Data Science Project on Online Retail Business Growth
The skills I demoed here can be learned through taking Data Science with Machine Learning bootcamp with NYC Data Science Academy.
Introduction
Data Analysis
Suggestions
References
Data ScienceIntroduction
Introduction: Growth of E-commerce
E-commerce has kept growing and become a new channel to support business development. It has helped large retailers expand their customer base by selling online and given small businesses a chance to sell directly to customers on their own sites or through a platform like Amazon’s. As a result, jobs created for e-commerce have grown 334% since 2002[1]. E-commerce has become the preferred way for many more people to shop. Particularly after COVID, when many stores were closed or people wished to avoid going out among other shoppers, the convenience of delivery to the home became necessary.
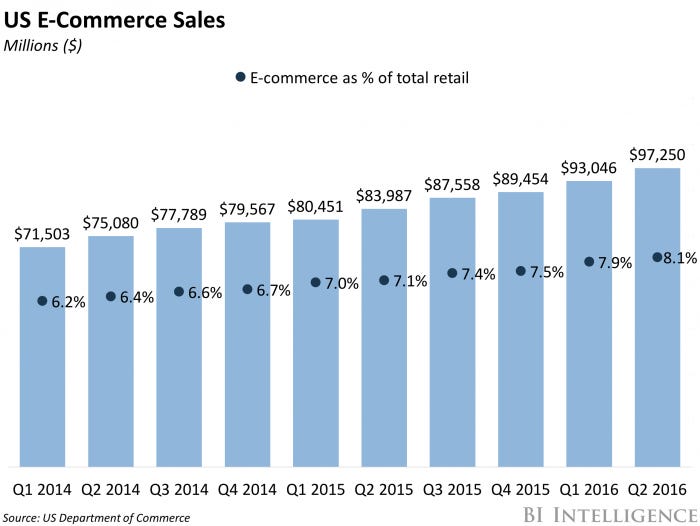
[2]
Introduction : An International Online Retail Business
The owner of the online store also has small businesses that buy in bulk and sell to other customers through retail outlet channels.
Information about the online shop business sales transactions:
- Business model: B2C retailer
- Location: London
- Year established: 2007
- Time of the dataset: 12.2018 - 12.2019
- Size of the dataset: 500 thousand rows and 8 columns
Data Analysis
We used Python built-in modules and analyzed sales, products and customers of the company.
Analysis: Overview
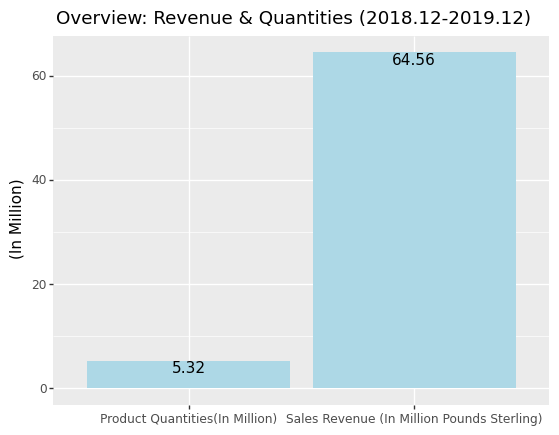

Discussion 1:
- The total sales revenue was about 65 million pounds sterling in 13 months. The biggest single sale revenue was over one million.
- The total volume of business was over five million products with about 3800 product IDs.
- The company served about 4800 customers in 38 countries.
Analysis: Monthly Sales
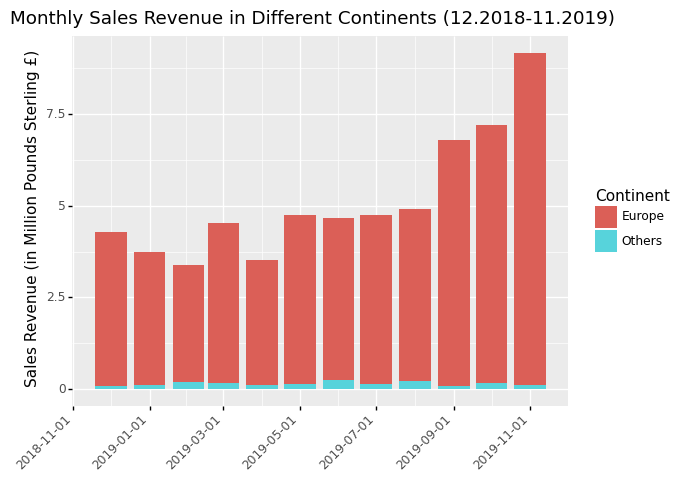
Discussion 2:
- According to the monthly sales graph, over 90% of sales revenue was from Europe.
- The sales revenue increased from December 2018 to August 2019 and grew rapidly after September. The revenue from November was more than double the amount of the lowest sales month (2019/2).
- Sales of the last month were very low. Because there were only ten sale days recorded in December.
Analysis: Customers
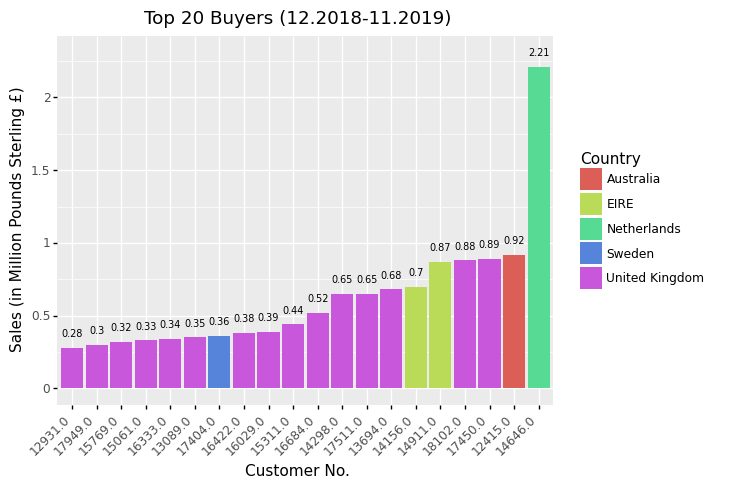
Discussion 3:
- Most of the top 20 buyers were from the United Kingdom. The biggest buyer, however, was in the Netherlands and spent about 2.3 million pounds sterling.
- There were 102 customers who only purchased once, and the one-time customers rate was 2.15%.
Analysis: Products

Discussion 4:
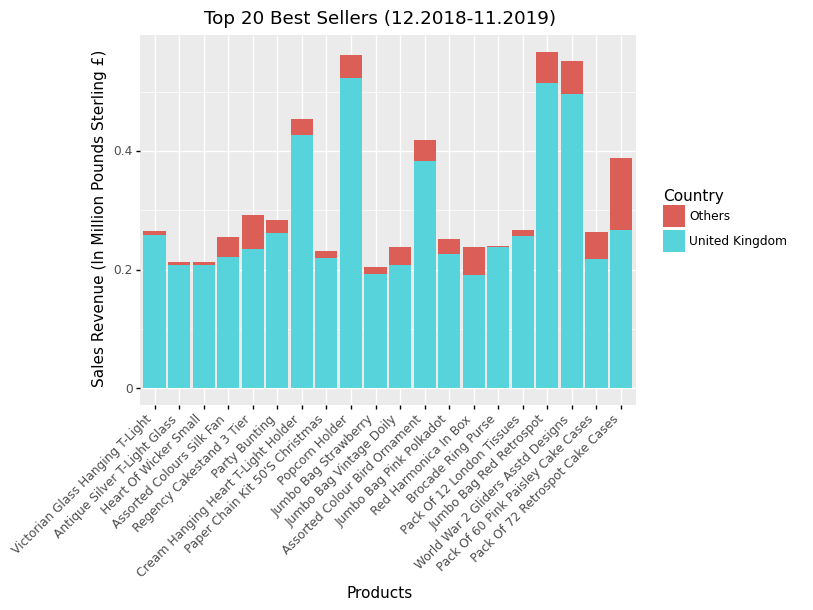
- The most popular product was a popcorn holder with total sales of almost 600 thousand pounds sterling.
- The product return rate was 5.06%. The top 20 return products were from the United Kingdom.
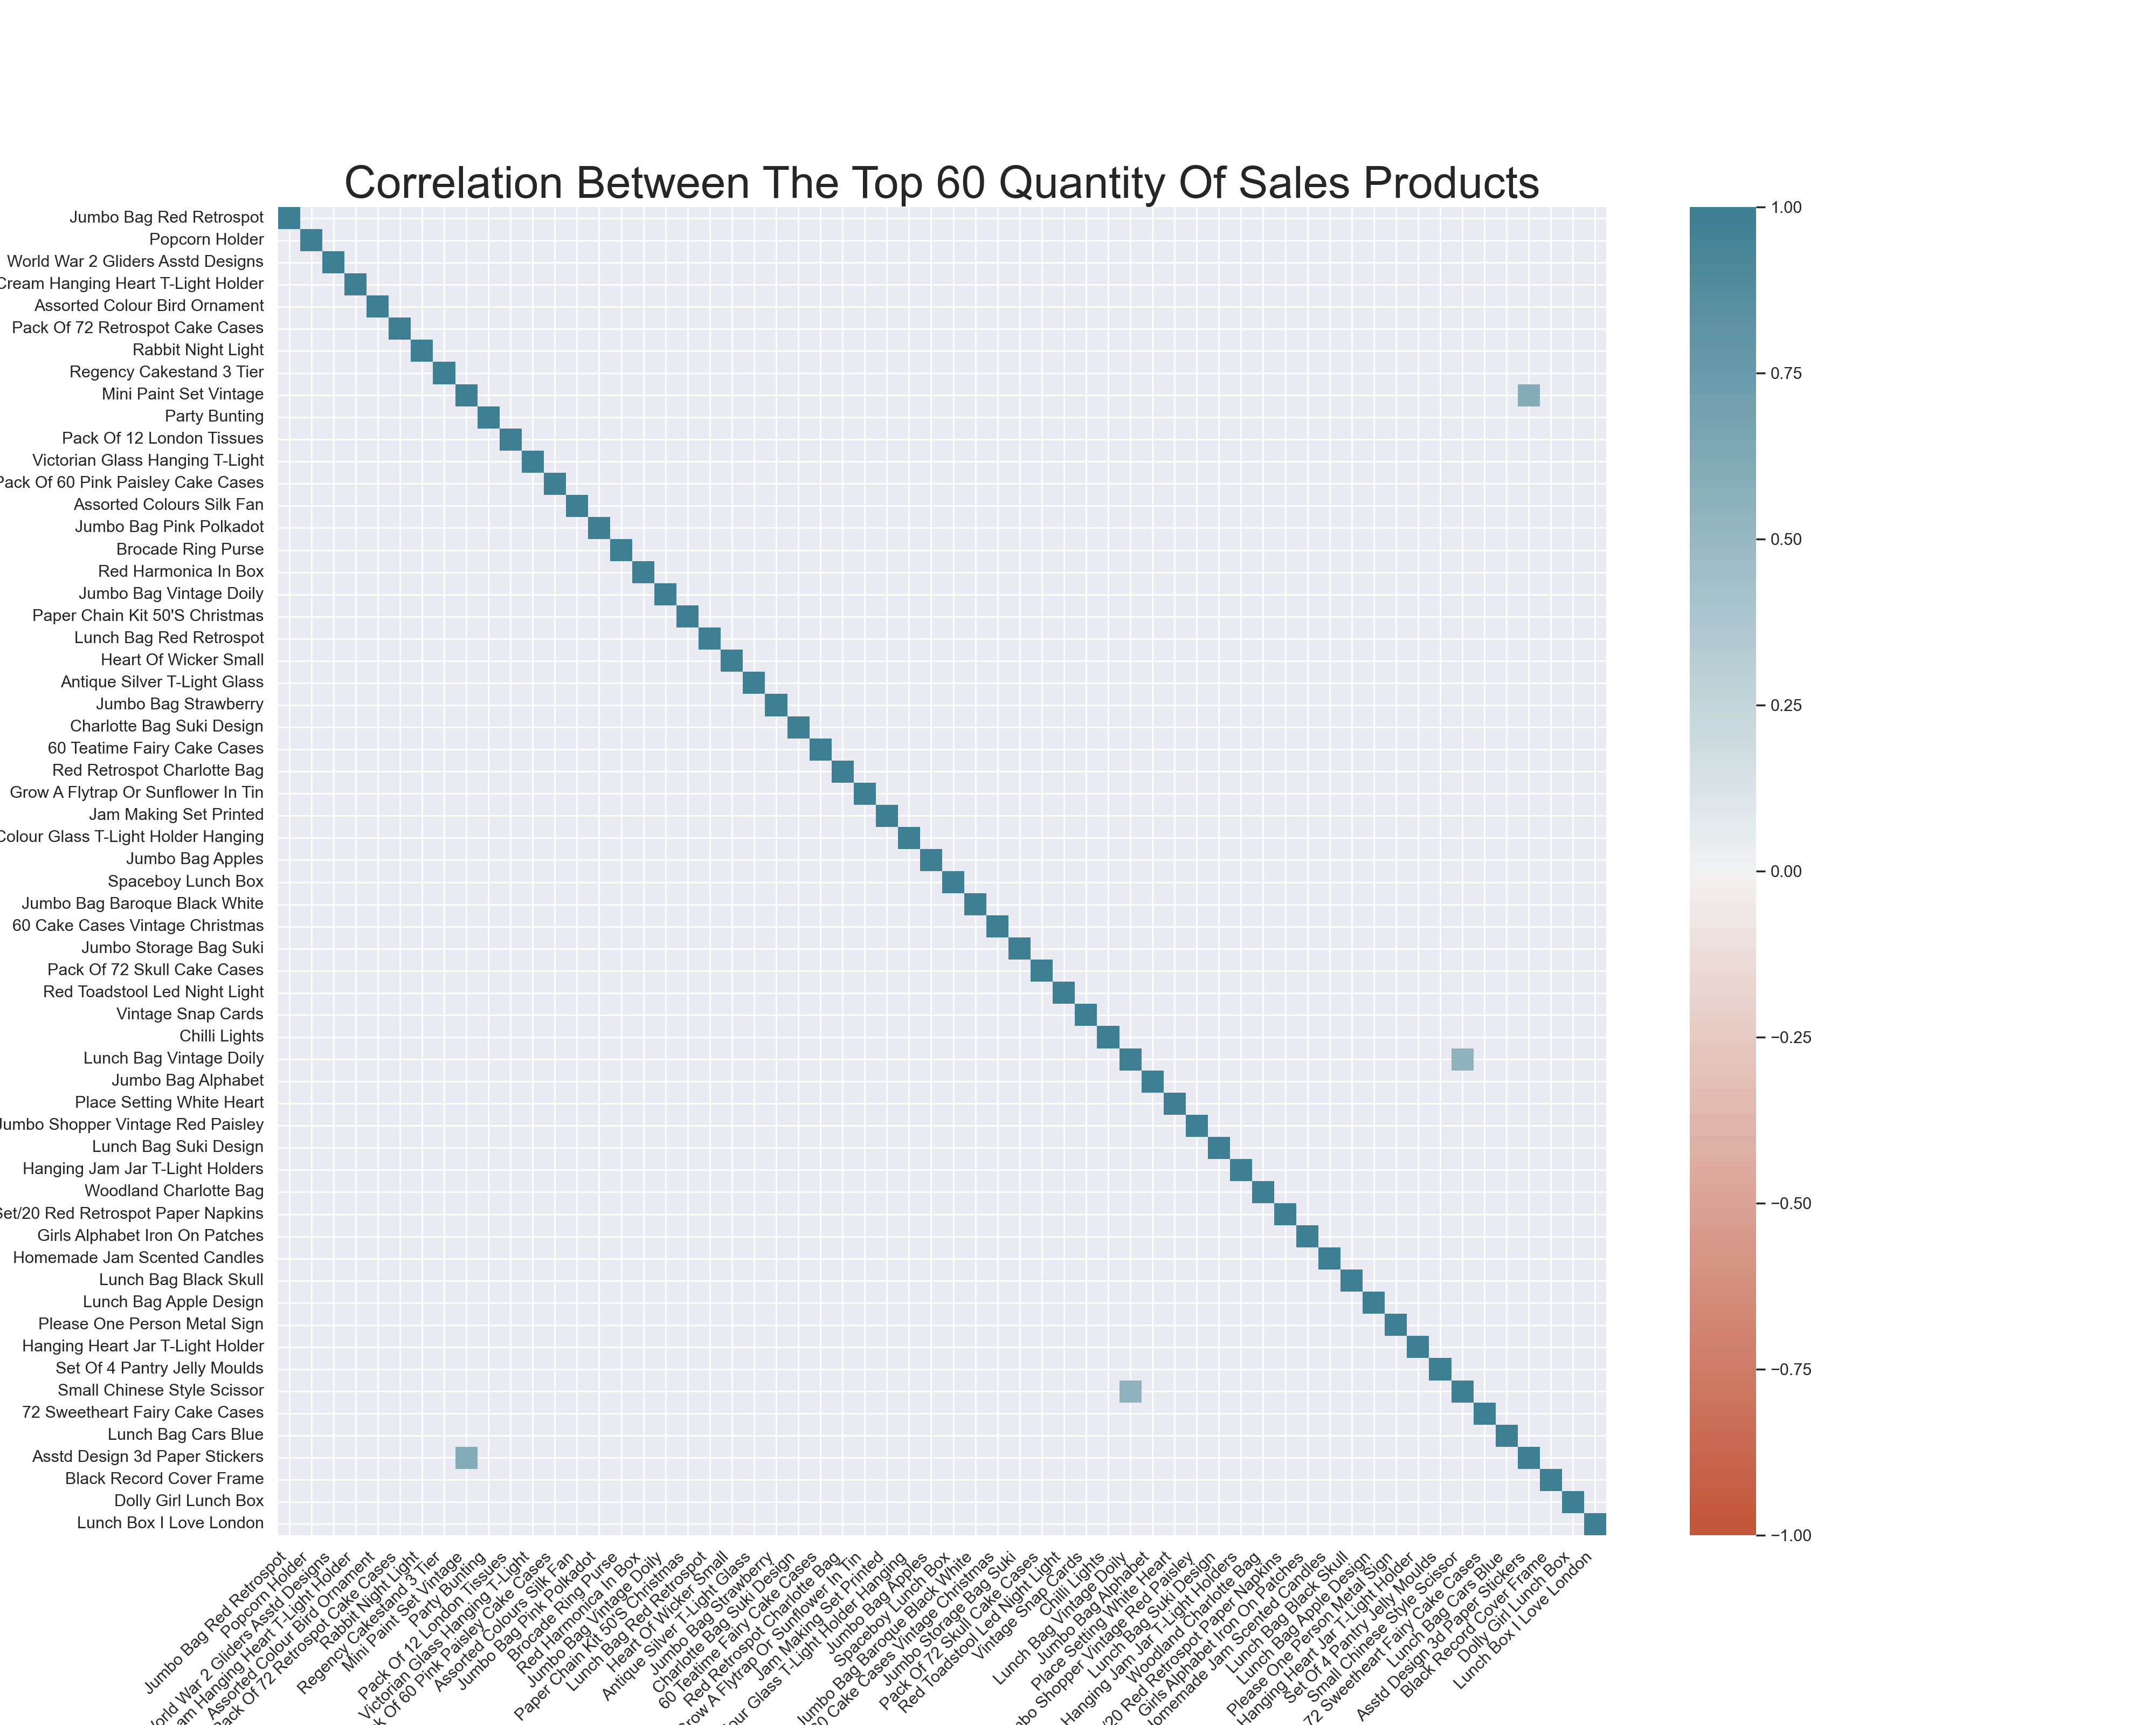
- We made a correlation heatmap of the top 60 selling products. It shows that the absolute value of correlation coefficient of the great majority of the 60 products were smaller than 0.5. From the graph, we can say that none of these products were accessories. They were all stand-alone products.
Suggestions
- The one-time purchase customer rate was 2.15% which means that the repeat customer rate was 97.85%. A repeat customer rate that is viewed as successful is between 20% to 40%[3]. We suggest that the company can invest more in marketing to expand the customer base.
- The product return rate of the year was 5.06%, which is considered a low return rate as compared to the average return rate 10.6%[4]. However, the top return product refunds were over one million pounds sterling, and the second-largest refund was over 0.75 million pounds sterling. Usually, a top return product was purchased by a lot of different customers. However, the top return product, Paper Craft Little Birdie, was purchased only once in 13 months. We can check the product’s quality, webpage demonstration and sale process to find out what needs to be improved.
- Based on the heatmap graph, we can tell that most of the popular products were not related to each other. We suggest that the company offer some sales promotions or recommendations for product pairings (Customers who bought this also bought that) to increase the quantities of products.
References
[1] "How the Growth of E-Commerce Is Shifting Retail Jobs". The New Nork Times.July 6 2017.
[2] "E-commerce growth has hit a two-year high". Insider. August 17 2016.
https://www.businessinsider.com/e-commerce-growth-has-hit-a-two-year-high-2016-8
[3] "Repeat Customer Rate". Geckoboard.com.
https://www.geckoboard.com/best-practice/kpi-examples/percent-returning-customers
[4] Repko Melissa. "A more than $761 billion dilemma: Retailers’ returns jump as online sales grow". CNBC. January 25 2022.
https://www.cnbc.com/2022/01/25/retailers-average-return-rate-jumps-to-16point6percent-as-online-sales-grow-.html
Dataset source: https://www.kaggle.com/gabrielramos87/an-online-shop-business