Data Analysis on Pricing Homes in Ames, Iowa
The skills I demoed here can be learned through taking Data Science with Machine Learning bootcamp with NYC Data Science Academy.
Introduction
Imagine you are a person try to sell a house. The main question is "how much should I sell it for?" In addition to that, one may consider the data on how much more one can sell if improvements are made, what improvements should be made, and how much investment is warranted before returns are diminished.
Here is an application of machine learning to housing prices in a Kaggle competition of data from Ames, Iowa. Full details can be found here: (Kaggle link)
Overview
The overall approach to this project is as follows.


What Data To Look Out For?
Two key things to look out for are 1.)missing values and 2.) high correlation between features (multicollinearity). There were 6 features with high frequency of missing values. None of these features are core features of a house. Therefore, they were simply dropped. I looked for features that had a correlation factor greater than 0.7, and dropped one of each pair.

Data on Different Models
Three models were attempted, simple multilinear regression, penalized linear regression, and random forest. The model with the highest test score was penalized linear regression. Simple multilinear regression had a high train score but low test score, which is a classic sign of overfitting.
However, I chose random forest because the feature importances were more stable. For penalized linear regression, the feature importances would move around every time I run the fit, which is mostly likely because of the randomized train/test split. Furthermore, normalization was not working for the linear regression models. When applied, the test scores would be unrealistically negative. This is most likely because the distribution of predictors between train and test split are very different, which is another sign that the model is overly sensitive to how the data is split.
Finally, sale price was transformed to log(sale price) to minimize the range of values and minimize prediction errors at the extreme values.
In order to improve the model further, I iterated through 2 parameters, n_estimators (number of trees used) and min_samples_split(minimum number of samples in a bucket before splitting. Optimal values were 123 and 2, respectively.
Random Forest
Features of the random forest model were ranked. The most important feature is overall material and finish quality. This feature has values ranging from 1 to 10. This is good news for home sellers. If a seller wanted to increase the value of the property, then they don't necessarily need to make less feasible changes like fitting another car in the garage, or just trying to make the house bigger when there is no more space.

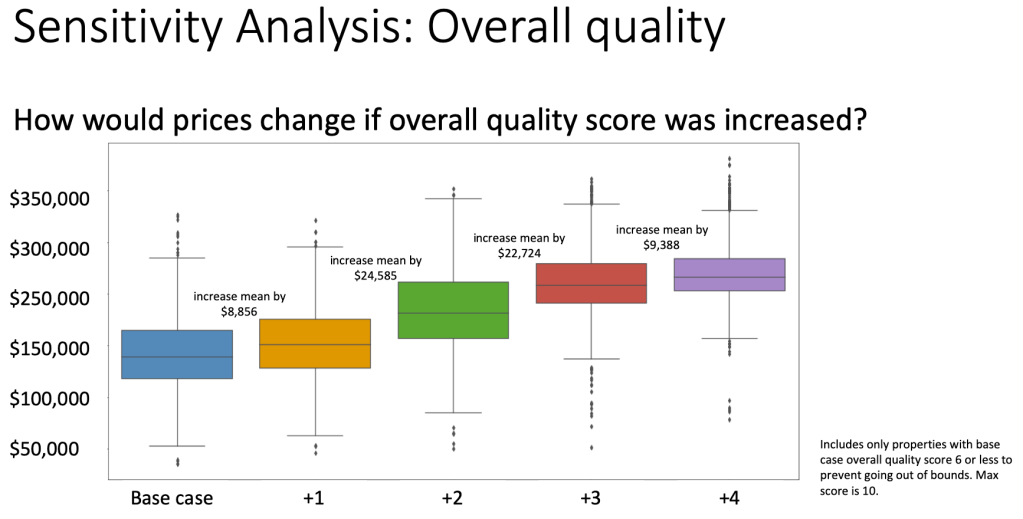
If a seller is going to invest in improving the overall finish of the home, then the next question is, "how much should I spend?" This is investigated by skewing the overall finish quality score. I took all the homes with overall finish quality less than 6, and increased the score up to +4. For each case, I ran the model, predicted the new sale price and quantified the changes.

Findings
This suggests that it may be worthwhile for a seller to increase the overall quality score by 3 for an average value increase of $56,165. Beyond that, the returns may be diminishing.
The second most important feature is 1st floor area, which can be thought of as the footprint of the house's main structure. Keeping all other features constant, I skewed this area up by 25% and observed the price change. I normalized the price change to the base case area of the home.

This is also good way to find out which neighborhoods have the most expensive price per square foot. This may be useful for a developer who is looking to build a house from an empty lot.
Consider that this is data from 2006-2010. The median price/square foot in Ames, Iowa today is $154 as cited by homes.com.
Average Price
Based on my model, the average price per square foot is around $20. This corresponds to a compound growth of 22% over 10 years. However, caution must be taken as this is just an estimate and the model can be further refined and studied.
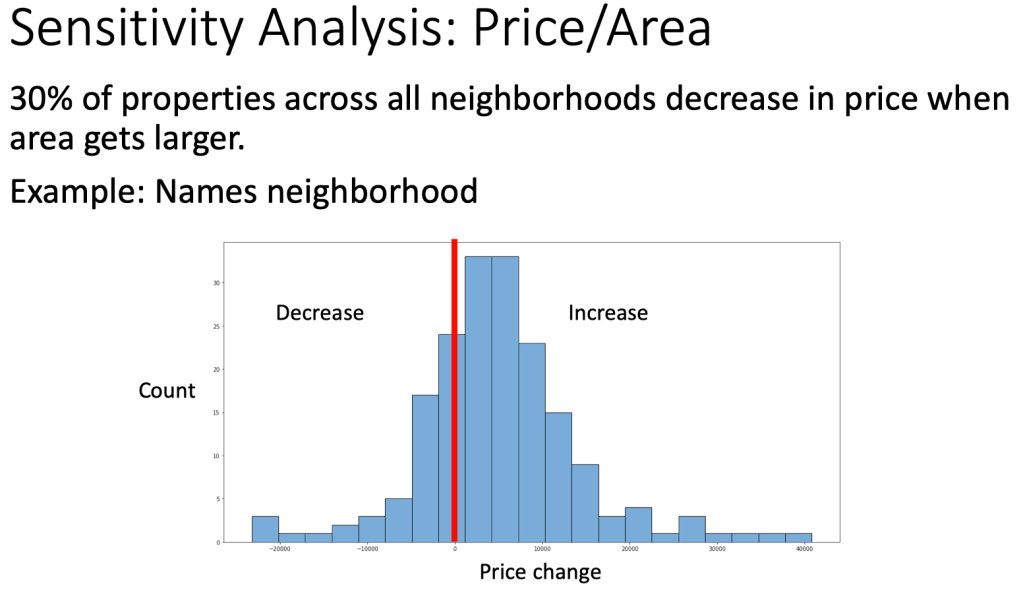
An interesting observation is that in some neighborhoods, the average price actually went down when the size was increased. It turns out that about 30% of all the homes decreased in value when the area was increased. Here is an example distribution from Names neighborhood.

Pricing Changes
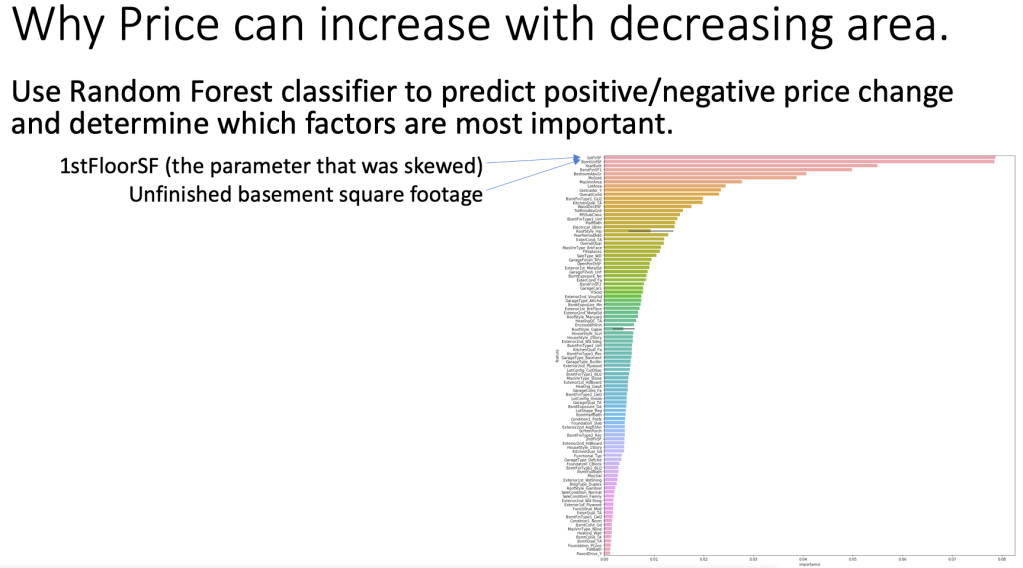
To investigate this further, I ran a random forest classifier to predict wether the price increased or decreased after skewing the 1st floor area. Then I looked at what key features could be influencing this.

The dominant features are the skewed feature itself (1st floor area) and unfinished basement square footage. This leads to meaningful insight: larger does not necessarily mean higher price.
One hypothesis is that buyers view an excessively large house as a liability. It would be harder and more expensive to maintain.
Conclusion and Further Investigation
This model can be useful for sellers in doing the following:
- Prioritize improvements. Sellers should focus on improving material and finish.
- determine where to develop or renovate given a price target.
- How to market. Sellers should understand the total area needs of the customer and match them with the appropriately sized house.
- How much to ask for. More rooms and more area doesn't necessarily mean more. Sellers can maximize profit by understanding the needs of each customer and matching it closely.
Furthermore, the analysis here can be extended by:
- skewing more features
- investigating the complex relationship between features (i.e. visualizing the random forest tree).

