Data Study on the Perfect RV
The skills the author demoed here can be learned through taking Data Science with Machine Learning bootcamp with NYC Data Science Academy.
LinkedIn | Github
In April 2019, I made a decision to move out of my apartment and live out of my mid-size SUV. I had an irresistible urge to be free and be able to sleep where ever the road takes me. I spent most nights on the Ice Age trail in South East Wisconsin and had my own version of luxury of waking up to a beautiful view of the endless prairie. As much as I enjoyed the freedom and nature, I was not a fan of digging holes in the middle of the night when I needed to use the bathroom or only being able to shower after going to a hot yoga class. I started looking into other data.
This is when I was drawn to the world of Recreational Vehicles. I spent countless hours watching videos of people traveling the world in RVs and converted camper vans. I couldn't help but envy the amenities that these people were enjoying from their vehicles. They truly were living in a home away from home.
As I searched to purchase a vehicle I can call home, I soon realized the financial burden of owning an RV. Purchasing an RV can cost anywhere from $10,000 to $500,000 plus maintenance and storage costs. Naturally, I looked into renting an RV for my next camping trip and this is where I got the idea of scraping rvshare.com to help fellow campers and van-dwellers choose the perfect RV for their next trip.
Scraping the data
Rvshare's search algorithm drops a point on the map and returns listings around that point. It was not possible to gather all listings in a particular state, so I had to settle for getting all listings within 20 mile radius of a certain major city.
Following this method, I collected data for 12,000 RV rental listings from rvshare.com by scraping listings near 23 major cities in the US using Scrapy.
Observations include price, vehicle type, max occupancy, length, vehicle production year, distance from city, and various kitchen, bathroom and entertainment amenities.
Data Transformation
The data on various amenities were collected in groups of bathroom, entertainment, temperature control and kitchen amenities in a string format. I transformed 3 columns containing strings with multiple amenities into 10 boolean columns that indicated whether the listing had a certain amenity.
In addition, I transformed string columns such as price, length, and distance to city to float columns so that I can observe these features as a continuous variable.
Removing Outliers
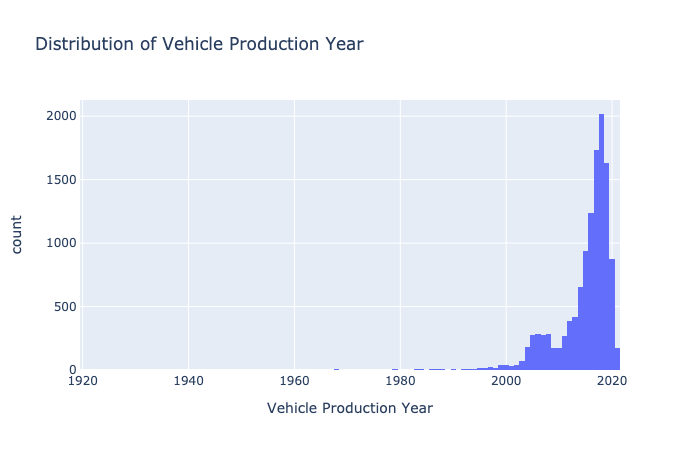
My dataset contained listings with vehicles produced in 1920 to 2021. However, most of the listings were from 2005 to 2021 so I decided to remove vehicles older than 2005 from my dataset.
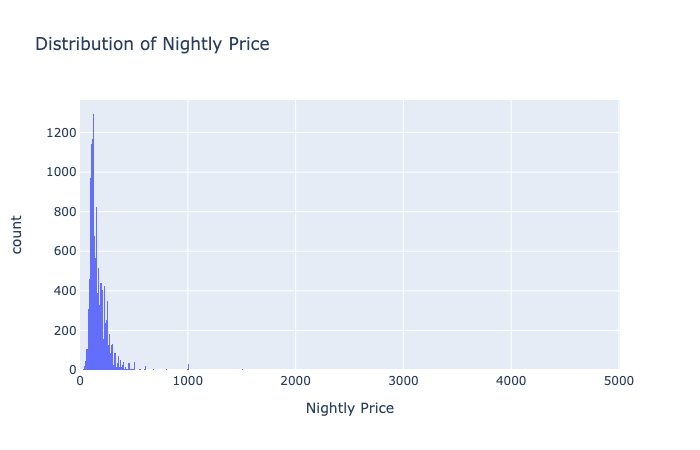
Nightly price was another variable I used to remove outliers. Since most of the listings had a nightly price under $500, I removed listings that were more than $500 from the dataset.
Analysis
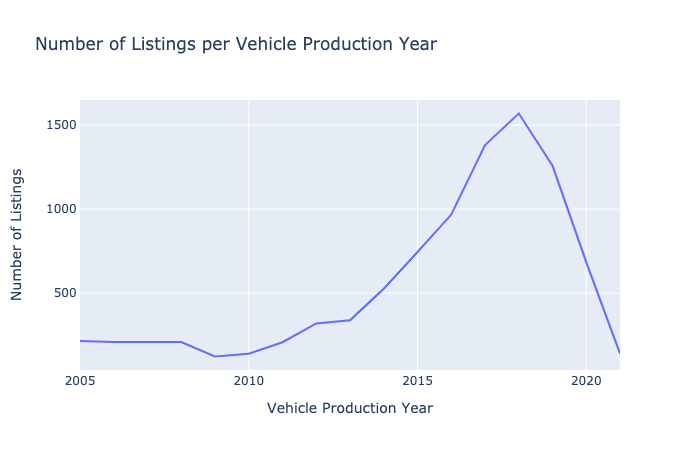
After removing outliers, you can see that newer vehicles have more listings from 2005 to 2018. This shows that RV owners look to rent out their RVs around 2 years after purchasing a brand new RV.
Vehicle Type Comparison
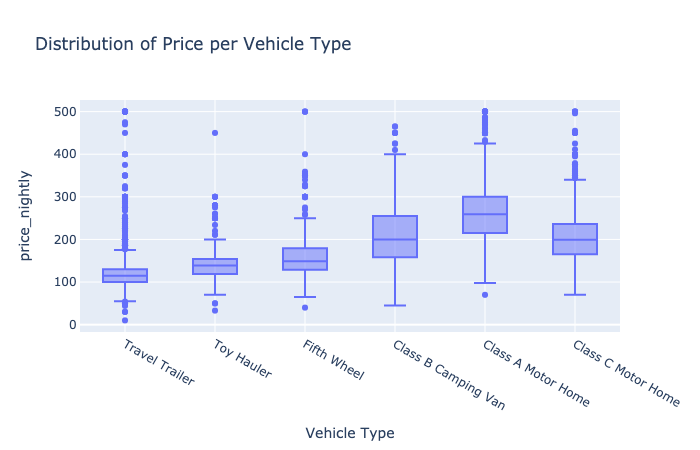
Let's break down our data set into vehicle types so that we can compare which type of vehicle would be best for your needs. The distribution of nightly price per vehicle type shows that the median price is lowest for towable vehicles such as Travel Trailers, Toy Haulers and Fifth Wheels. As expected, Class A campers had the highest median price. Class B and C campers had similar median prices.
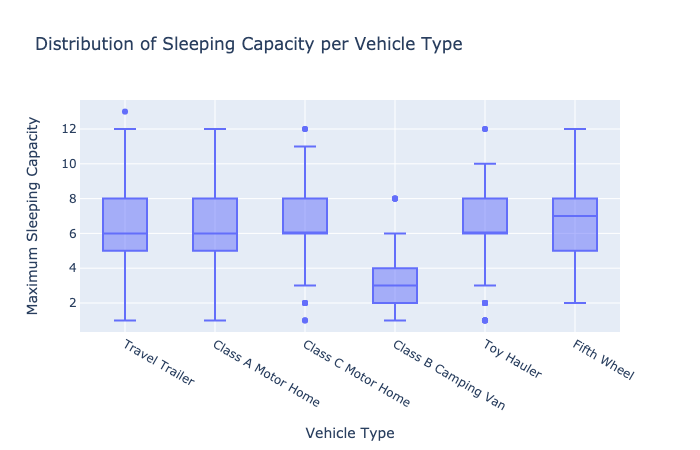
Sleep Capacity
The biggest factor in determining RV to rent would be how many people can sleep in it since you want to make sure everyone on your trip can sleep comfortably. Class B camper vans can sleep on average of only 3 people while all other vehicle types can sleep 6.
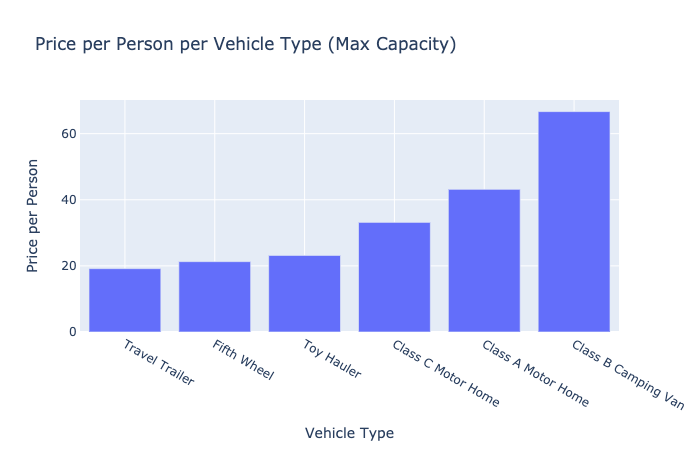
Price Per Person (Max Capacity)
Using the nightly price and the maximum sleeping capacity, I calculated how much each person would have to spend in an optimal situation where we can fill up the maximum capacity of the RV. The bar graph below shows that towable vehicles were the cheapest per person while class B campers are the most expensive per person.
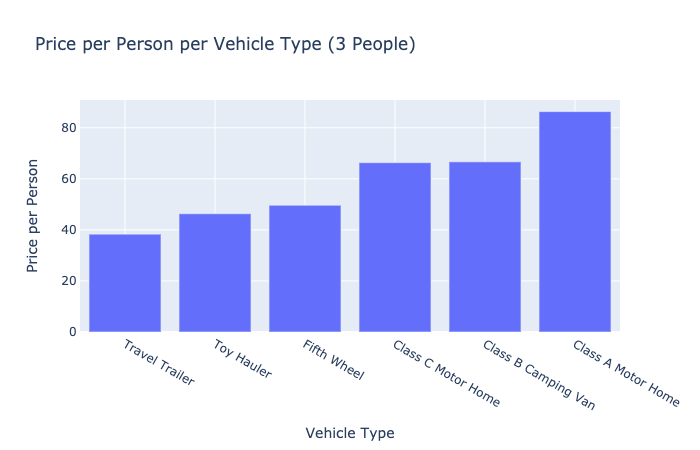
Price Per Person (3 People)
However, we are not always able to fill up the RV to its maximum capacity. The bar graph below shows what you should expect to pay per person for a group of 3 people. While towable vehicles are still the cheapest, Class A motor homes are the most expensive.
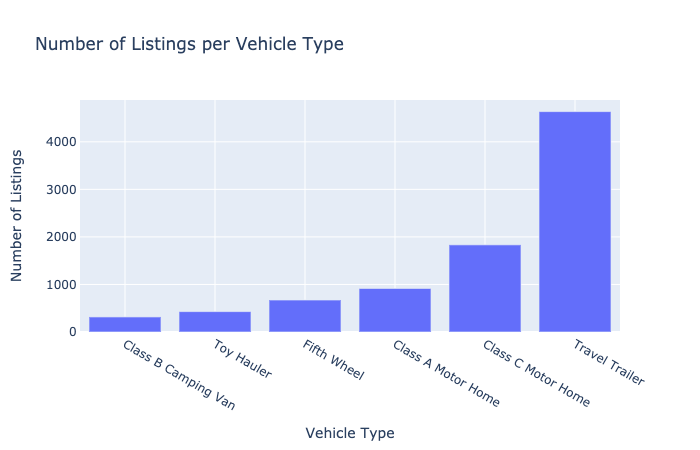
Number of Listings
Now that we looked at what type of vehicles are most and least expensive for max occupancy and for a group of 3, let's see if any vehicle type is easier or harder to find. Looking at the number of listings per vehicle type, Class B camper vans are the rarest to find.
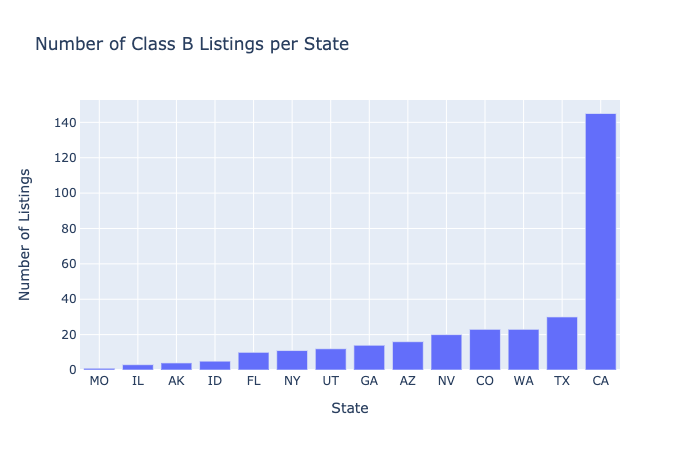
Class B Listings
To help those of you who want to rent a Class B camper, I looked at which states have the most Class B campers. The bar graph below shows that California has the highest number of Class B campers.
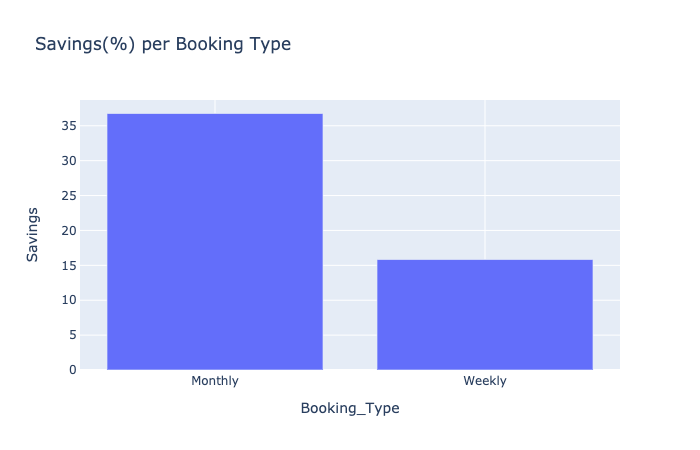
If you are going on a long trip, you might want to consider booking weekly or monthly. On average, you can save 36% by booking monthly and 16$ by booking weekly.
Booking Type Comparison
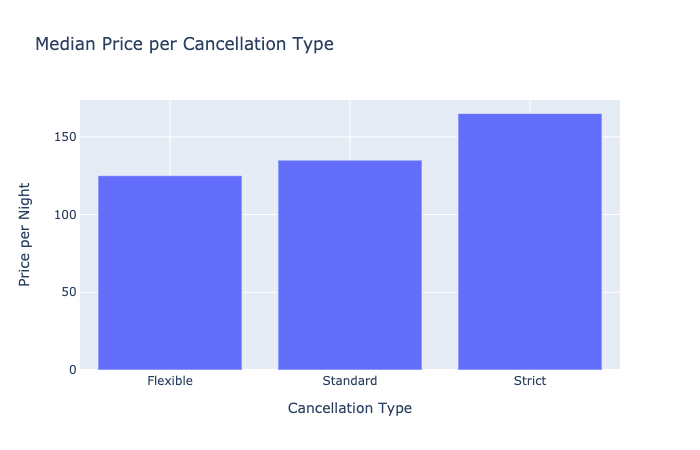
Cancellation Type Comparison
The effect of cancellation type on price was not as I expected. As a consumer, I expect vehicles with stricter cancellation type to be cheaper since I have less flexibility in my trip. However, the inverse is true. Vehicles with strict cancellation policy had a higher median price than vehicles with flexible cancellation policy.
This relationship better explains owners' perspective. Owners with more expensive RVs want to take less risk of customers canceling their trip.
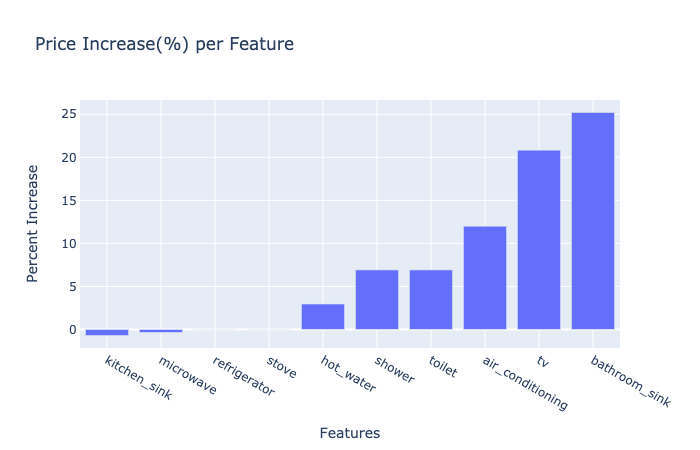
Amenity Comparison
Finally, I compared the median price of RVs having an individual amenity with the the median price of those without such amenity to calculate the price increase per feature. The result shows that kitchen amenities did not result in a price increase. However, having bathroom, temperature control or entertainment amenities did increase the price of the listing.
This result shows that campers are willing to pay to avoid using campsite bathrooms or sleep in the hot/cold. In the contrary, campers enjoy cooking outside and in the campfire rather than in a vehicle so they are less willing to pay more for kitchen amenities
Decision Tree
To summarize my findings, I built a decision tree to help plan you next adventure. If you have a vehicle with a Class III hitch, you want to rent one of the towable options to minimize costs. Specifically, if you need to fit motorcycles or other 'toys' and need a garage, you should get a toy hauler. If you have a heavy duty truck, get a fifth wheel. Otherwise, go for a travel trailer.
If you need an RV with an engine, you need to choose between Class A, B and C campers. Class B would be ideal for trips with fewer than 3 people while Class A and C is best for trips with more than 3 people. If you want a luxurious experience with more than 3 people, Class A is the right choice. If you are okay with having a cozy camper van for your group of more than 3 people, Class C is the right choice for you.

Further analysis
I was not able to scrape a complete list of RV listing for each state due to the search algorithm rvshare.com uses. If I were able to obtain the total number of listings per each state, I would merge the data with total number of national park visitors by state. Comparing the number of listings (supply) with the number of park visitors (demand), I would be able to see which states lack RV rental listings compared to the demand. This information would help rvshare.com determine which states they need to advertise to get RV owners to post their vehicles on their platform.