Runtime vs. Success (Using IMDB)
The content in this blog comes from a shiny application proof of concept using IMDB movie data:
- IMDB Movie Data App on Shiny.io (Click To View the R / Shiny Dashboard app)
- Source Code on Github
Note: Updates to this code are in progress. When posted, the code demo (accessible by the hyperlinks) will have more to show than is explained in this blog post.
Background and Inspiration:
Years ago, students of film writing were advised to make their feature length movie scripts between 90 and 129 pages. A page is expected to be one minute of runtime. Today these numbers have been revised to a simple target of 110 minutes. A little fun fact connected with this: my professor tells the story of an insider’s view from development and how the decision makers at one of the giants used to pick up a screenplay, weigh it in his hands, and say “too light” or “too heavy." Then the script was rejected without ever getting a single page read. Are these page length numbers arbitrary, or is there something to these guidelines?
A Walkthrough of The Shiny App And What It Can Tell Us
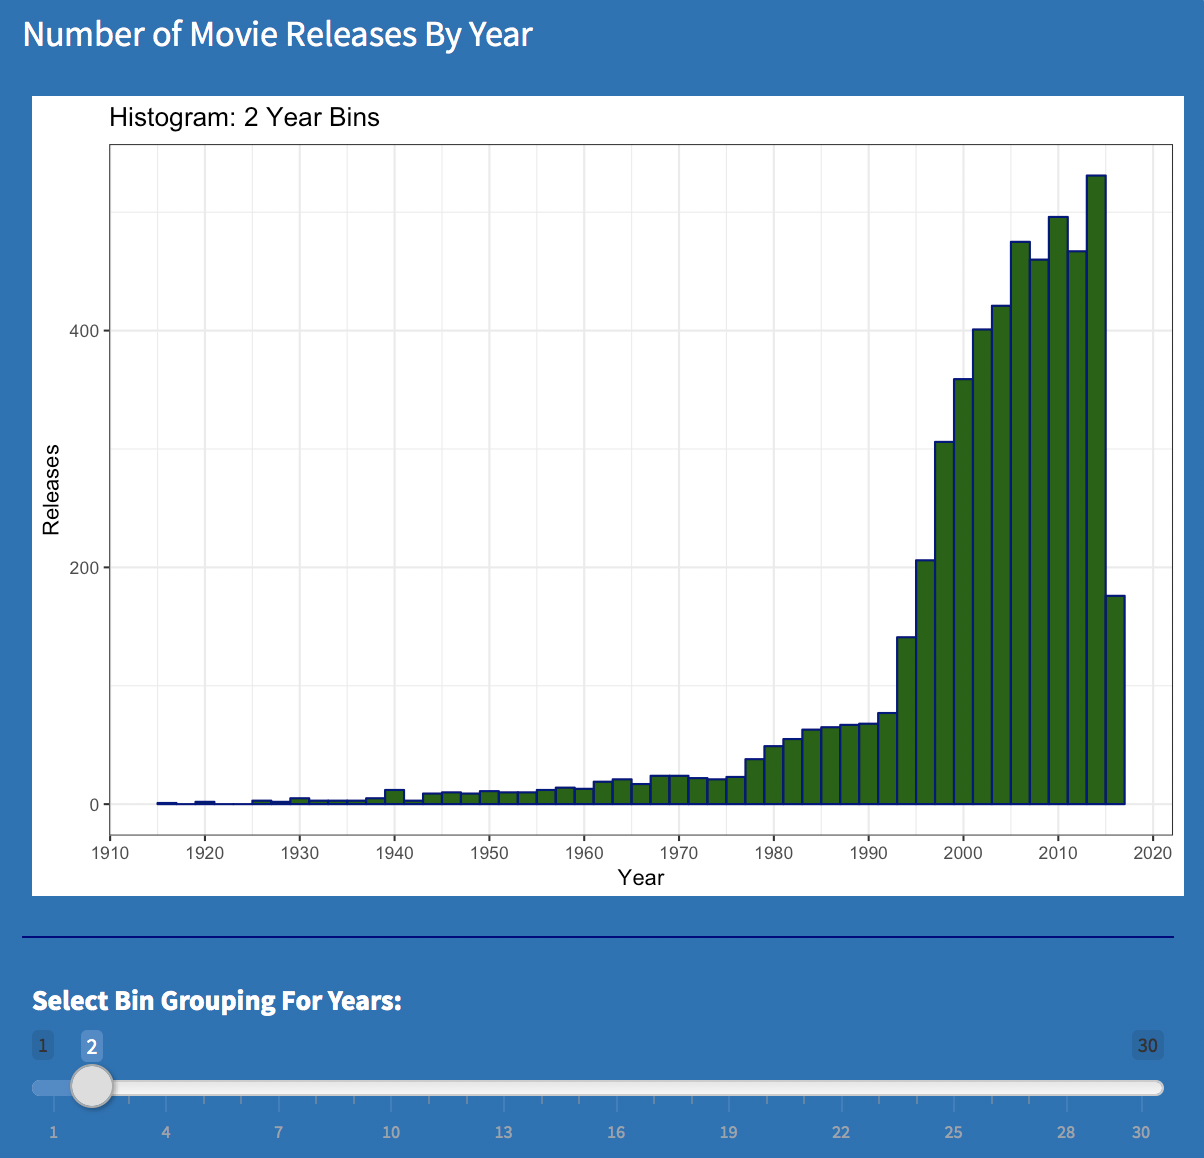
Movie Releases by year - Small Bins |
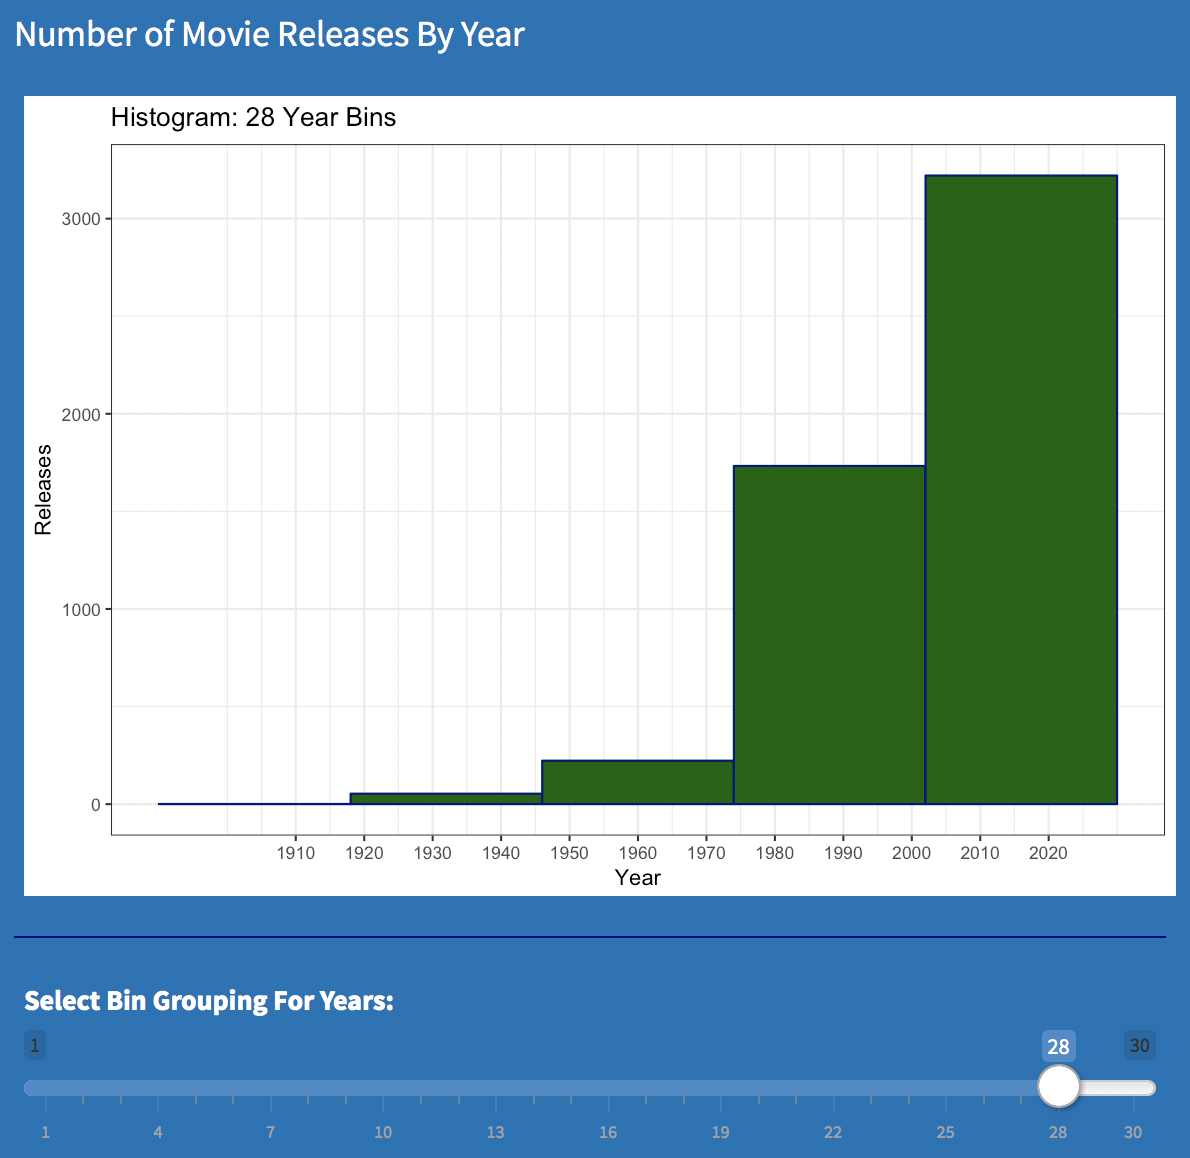
Movie Releases by Years - Big Bins |
With the bin size set very small in the above visualizations, we can see movie releases increasing over time, with the rate accelerating much more starting in the 1970's. Increasing the bin size from 2 to 28, further illustrates how in recent years, there are so many more movies then in the past.
A quick look at the history may shed a little light on what's going on here. The first motion pictures were created in the 1890’s and were little more than short, black and white moving images. As the novelty of this waned, next came serial shorts from which the term “cliff hanger” originates. When real full-length stories started to evolve, they were expensive and hard to produce. As a practical matter, only small numbers could be made per year. Today, the bar has been raised but technology keeps lowering the cost of what it takes to meet that bar. Independent and ancillary markets have widened the distribution channels and even YouTube is becoming a part of this expanding network. It’s just a matter of time before low budget movies get made on smart phones if they haven’t been already. Nothing earth shattering here but the visualization does help show that the run-away escalation started during the time when “Star Wars”, “Jaws”, and "Close Encounters of The Third Kind” all made their debut. Many see this time as “the beginning of the blockbuster.”
As shown here, the data used in this application is organized into 5 subsets of data:

IMDB Shiny App - Data Tab |
There is some overlap in the data sets shown on the application's "Data" tab:
- The 5270 “Kaggle 5000 Project IDs” data set contains the results of merging 5000 movies whose IDs were obtained from a "Kaggle" project with the unique IDs from all the other data sets listed in the above screenshot. The "Kaggle Project IDs" included a sample of releases from 1916 up until 2016.
- The other data sets came from Top and Bottom lists on IMDB. Most of the Top 250 English Movies were also in the “Top 250 Movies”. Some of the “Top 250 Indian Movies” are also in the “Top 250 Movies”. The Bottom 100 should only overlap with the "Kaggle" data set. Movies in these lists include titles from 2017.
Click on the "Visualization" tab of the app to obtain basic stats on each of the aforementioned datasets (Min, Max, Mean, Median and Quartiles) for these 4 numeric variables:
- Year Released
- Runtime (in minutes)
- Number of Reviews
- Movie Rating
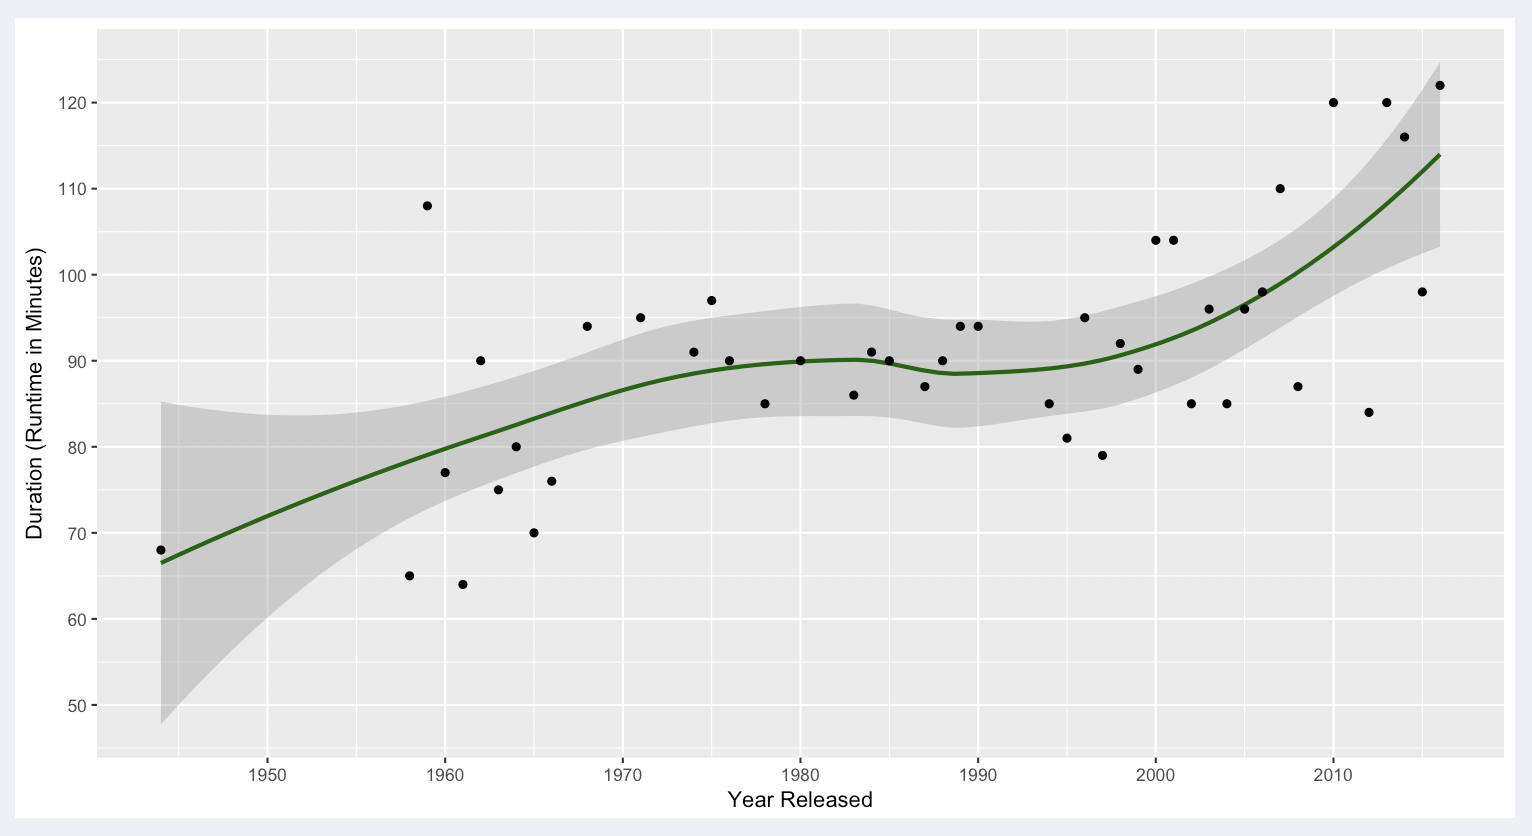
This tab also provides a line plot using Loess linear regression which we can analyze for the general trend in movie runtimes that we are looking for.
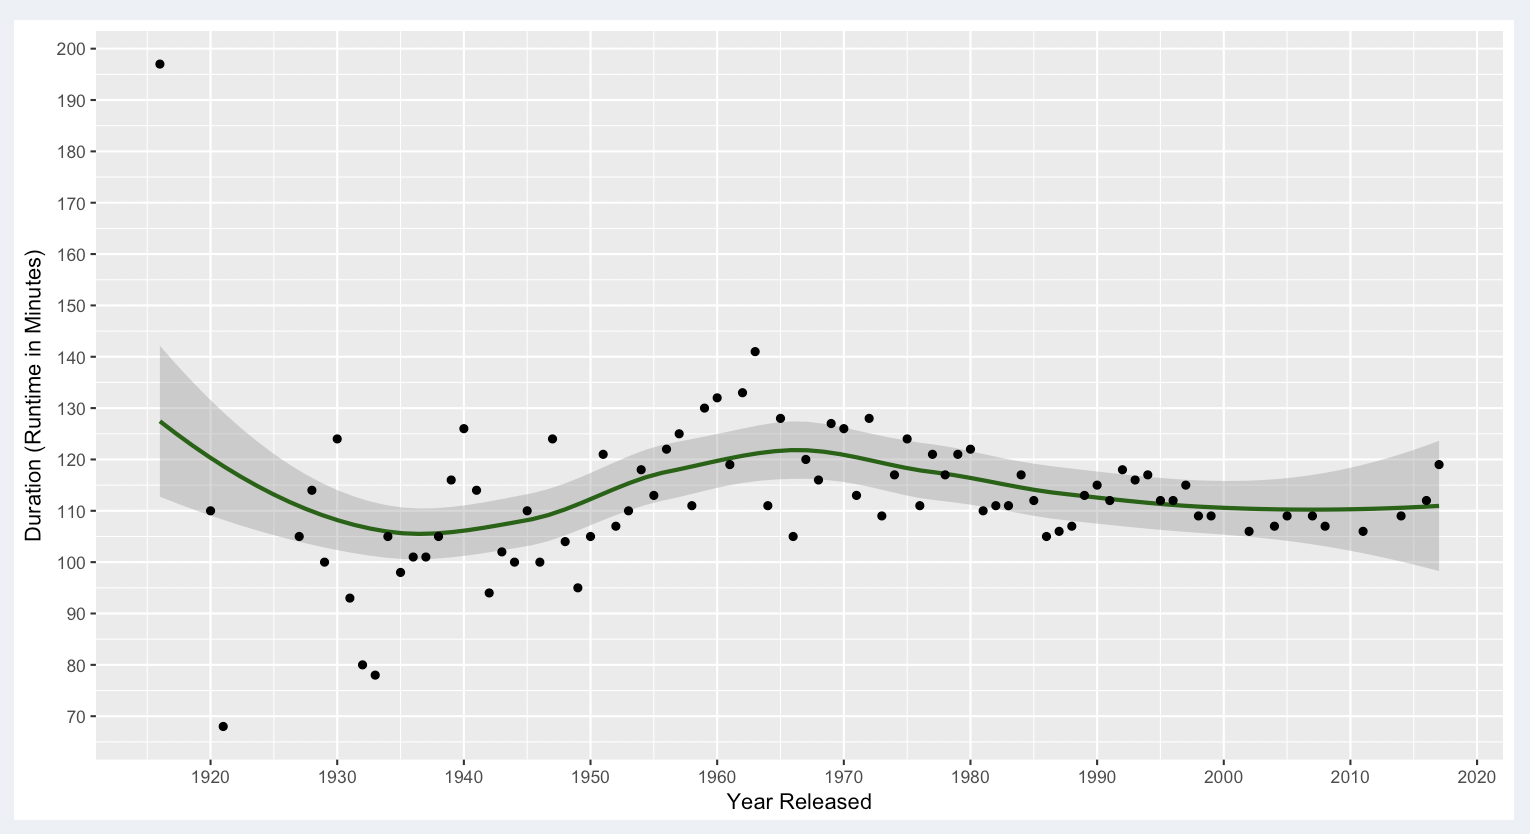
"Kaggle 5000 Project IDs" Record Set (All of Our Data)
If we start with the plot for “all the data” in our application, outliers are mostly clustered pretty close to the general confidence interval for the model. No outliers outside this range appear after 1990, and only a small number of points barely outside the confidence interval appear from 1960 to 1990.
Since there is a limited outlier effect, the mean seems like a reasonable metric. It is 109.2 minutes. Of more interest to the original question, this plot essentially reflects a 5000+ record sample of what got made. The hills and valleys of the line seem to range between 105 and 120 minutes up through the 1970’s. Then the line becomes a slightly downward sloping trend up through the present with our data points mostly appearing at around the 110 minute mark. Though anecdotal in nature, the original 110 minute recommendation for movie scripts would seem to be supported by the data. The confidence interval around the line though might suggest a range from about 100 to 120 minutes. If our movie gets made, we may then be concerned with what are its chances of making it into the top or bottom? Starting with the Top 250 Movies:
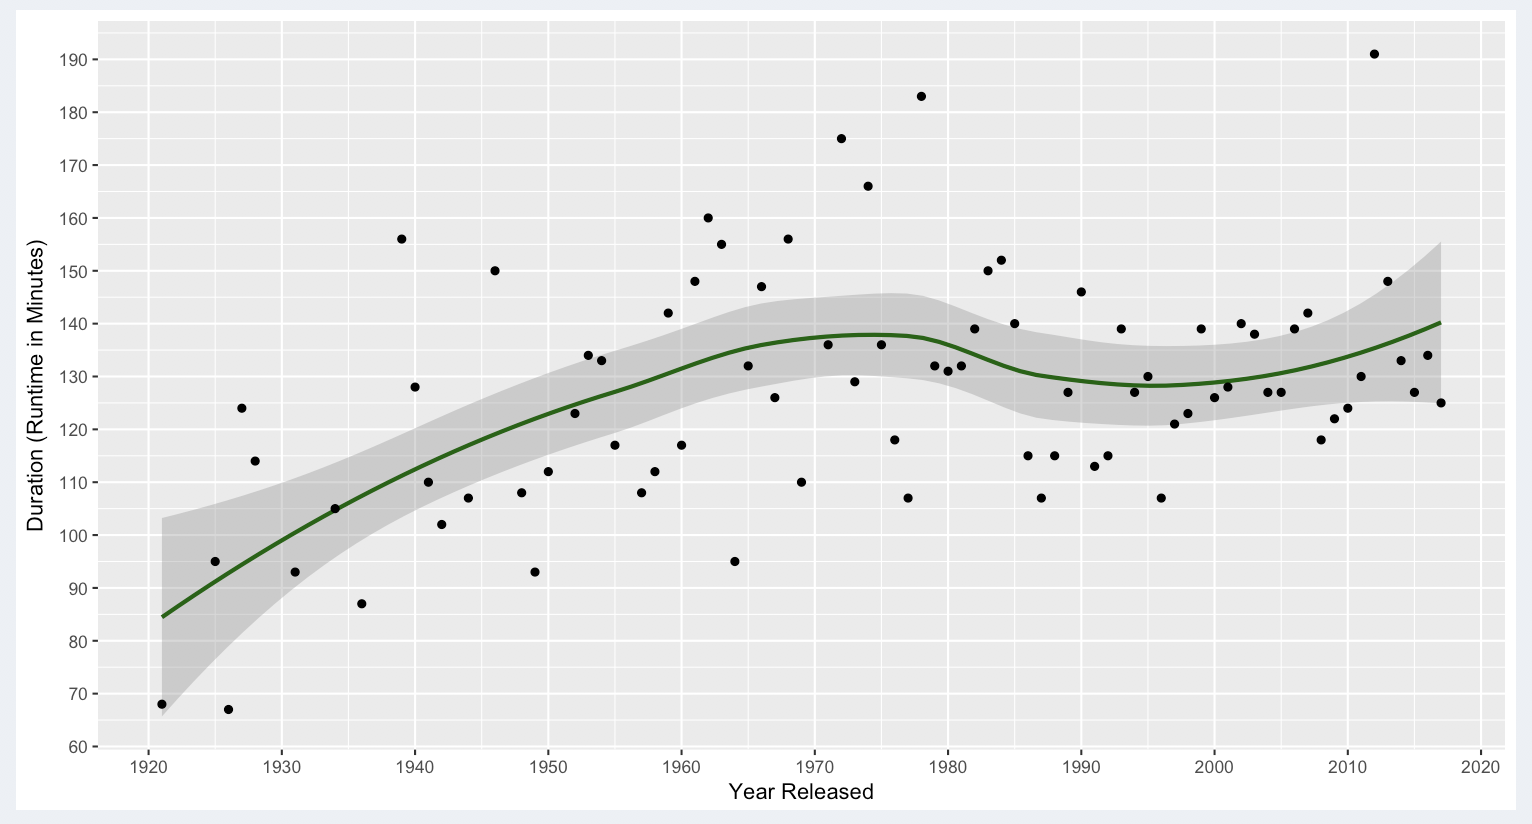
Top 250 Movies (On IMDB)
The mean for the Top 250 movies was 130 minutes. The curve trends upwards over all with a range in recent years (1990 to the present) that fell between: 130 and 140 minutes. There are a larger scattering of outliers on this plot, but based on how the outliers mostly cluster not too far from the confidence interval after 1990, the mean still seems reasonable to use. If we think about why these better received movies are often longer than the general trend for what gets made, I’m sure there are many factors involved. For one thing, big name directors and producers have the kind of clout to make us sit through longer movies. Consider “The Lord of The Rings” saga, which collectively was over 9 hours long with each of 3 movies lasting around 3 hours a piece.
We don’t want to end up in the bottom, so we'll take a look at this too:
Bottom 100 Movies (on IMDB)
The mean for the Bottom 100 movies was 92.26 minutes. This curve is also showing a distinct upwards trend over all but with a range in recent years (1990 to the present) that was from about 90 minutes to 115 minutes. There are fewer outliers, but there is also less data in this grouping.
In Conclusion
Note that for this application about 6000 IMDB records were obtained. In 2017 alone, IMDB recorded 12,193 new releases by July and the year was still young at that point int time! Further analysis is indicated and performing the analysis with more data would also be helpful. Given the small size of the data, findings here should not be taken as an absolute. Given that, here is a summary of what the data suggests so far:
- The "Sweet Spot" to target for a feature length screen play to get made is about 110 minutes
- If we want that movie to make it into the Top 250 on IMDB, the final movie is expected to range from 130 to 140 minutes (when produced)
- It is also interesting to note that movies in the bottom 100 tend to range between 90 and 115 minutes
With more time and development, a more thorough analysis could be developed from IMDB data.
The Data Collection Process
Three R markdown scripts (available on Git) were used to gather source data. A full workflow from initial input files to what got used in the application is provided in the third script. As this process was experimentally developed and modified while creating the source data for this project, R markdown was used to step through the process and keep notes on what was going. High level:
- An XML based R library was used to screen scrape data from “hot lists” (Top 250, Bottom 100, etc.) directly off of the IMDB website in July of 2017. This produced 'csv' files used as source for all the “Top / Bottom” lists provided in the final application.
- 5000+ IMDB IDs were extracted using a software process (not documented) from a json file posted with a Kaggle project. That project last gathered data in 2016. IDs from steps 1 and 2 were then used with step 3 to extract current data on these IDs.
- An Open API referred to as “IMDB Open API” was used to extract records from the IMDB website one record at a time, with a 3 second delay between each extraction. This was to ensure no harm to the website. This script was designed to save its work “along the way” and provide helpful output messages so that if an error occurred that halted the program. Data collected so far would be available, and the script could then pick up where it left off to finish the job.
- Close to 6000 observations in total (5270 after filtering out of duplicates) w/ about 27 variables were obtained from IMDB.
- Data cleaning of just the 7 variables brought into the Shiny application ensued with the intent to clean other variables in future development iterations. The vision was to develop subset tables with Movie_IDs on each one as a unique identifier, and then join them to previous data when bringing in each new set to expand the app in support of new analysis and features.
The Initial Plan for this Project
The CEO of a company I used to work for would tell stories of how senior management of various IT areas under him would plan and design solutions on a napkin in a bar which formed the basis of software project requirements. For this shiny app, the “napkin” was actually a piece of notebook paper captured as a PDF for your amusement. Only a small piece of this plan has been realized so far.