See for Yourself : Higher Education + Work Hard + Happy Marriage = Good Life ???
|
Contributed by Conred Wang. He is currently in the NYC Data Science Academy 12 week full time Data Science Bootcamp program taking place between September 26th to December 23rd, 2016. This post is based on his second class project - Shiny Project (due on the 5th week ofthe program).
|
.
.
Higher Education + Work Hard + Happy Marriage = Good Life ?
See for yourself
Most asian parents tell their children, "If you have higher education, work hard and are happily married, you will be blessed with a good life." In the blog I Told You So, using R and ggplot2, we visually explored the Adult dataset, from UC Irvine Machine Learning Repository, in order to find out if what Asian parents say is a myth or a fact. In that study, income of more than $50K is used as a proxy for "a good life" and we focused only on Asian adults (race) who worked in the private sector (work class). In this study, using Shiny, we examined the same data set, but checked the myth/fact against all available races and classes.
 +
+  +
+  =
=  ?
?
.
Data Set & ETL
As stated in the section Data Set of the blog I Told You So, the Adult dataset was originally used as an exercise in predictive analytics to see what factors predict income exceeding $50K/year. It is based on the 1994 census data. In this study, the data is being used to explore the relationship between education, work hours, marital status and earnings.
- Information about Adult Dataset can be found at [https://archive.ics.uci.edu/ml/datasets/Adult].
- There are 32,561 observations in the dataset.
- There are 15 attributes.
For the current study, we performed the same ETL (Extract - Transform - Load) operations on the dataset as we did for the previously study. Thus, we will not re-publish all the detail here. Please refer to the ETL section of the blog I Told You So for more information.
.
Shiny & ShinyApps.io
Not only does using Shiny make our myth/fact investigation against all available races and classes super easy, it also empowers us to share our findings with our colleagues via the internet. The reader can click here to try it out himself :
.

.
Moment of truth...
+ + = ?
For each of the good-life factors (education, work hours, marital status) , we applied our software repeatedly on all combinations of races and classes, and we compiled the results, there are few things worth mentioning.
First, our results will be presented in table format with races vs. work classes:
| race | work |
|
|
Legend:
| symbol | meaning |
| Y | Yes, the good-life factor seems to be true.
|
| N |
No, the good-life factor seems to be false.
|
| S | No noticeable difference between the "<=50K" group and the ">50K" group. |
| 0 | No data. |
| No data for earning group ">50K". |
For the three tables shown below, you will find all "0"s (no data) under work-class column "NEVER" ("Never-worked"). We found that there are 7 observations in the Adult dataset with "Never-worked", and they all have missing value (i.e. the "?"). We did not use these records, but we kept "NEVER" ("Never-worked") as a factor in order to test and demonstrate Shiny exception handling ability.
|
18,Never-worked,206359,10th,6,Never-married,?,Own-child,White,Male,0,0,40,United-States,<=50K
23,Never-worked,188535,7th-8th,4,Divorced,?,Not-in-family,White,Male,0,0,35,United-States,<=50K
17,Never-worked,237272,10th,6,Never-married,?,Own-child,White,Male,0,0,30,United-States,<=50K
18,Never-worked,157131,11th,7,Never-married,?,Own-child,White,Female,0,0,10,United-States,<=50K
20,Never-worked,462294,Some-college,10,Never-married,?,Own-child,Black,Male,0,0,40,United-States,<=50K
30,Never-worked,176673,HS-grad,9,Married-civ-spouse,?,Wife,Black,Female,0,0,40,United-States,<=50K
18,Never-worked,153663,Some-college,10,Never-married,?,Own-child,White,Male,0,0,4,United-States,<=50K
|
.
Higher Education
-Dad & Mom: You are right!
- When clicking on the "Higher Education" tab, you will see the following screen:

- As there are more "Y"(yes) than "N"(no) and "S"(same) combined, it indicates that people who earn more do have a higher mean number of years of education:
| work | GOV | NEVER | PRI | SELF | NOPAY | <all> | ||||||
| race | female | male | female | male | female | male | female | male | female | male | female | male |
| A.I.E. | Y | Y | 0 | 0 | Y | Y | Y | Y | 0 | 0 | Y | Y |
| A.P.I. | Y | Y | 0 | 0 | Y | Y | Y | Y | 0 | Y | Y | |
| Black | Y | Y | 0 | 0 | Y | Y | S | Y | 0 | |
Y | Y |
| Other | |
N | 0 | 0 | Y | Y | 0 | Y | 0 | 0 | Y | Y |
| White | Y | Y | 0 | 0 | Y | Y | Y | Y | |
Y | Y | |
| <all> | Y | Y | 0 | 0 | Y | Y | Y | Y | |
Y | Y | |
.
Work Hard
- Dad & Mom: You are right again!!
- When you click on the "Work Hard" tab, you will see the following screen:

- As there are more "Y"(yes) than "N"(no) and "S"(same) combined, it indicates people who earn more do work hard (i.e. longer hours):
| work | GOV | NEVER | PRI | SELF | NOPAY | <all> | ||||||
| race | female | male | female | male | female | male | female | male | female | male | female | male |
| A.I.E. | Y | N | 0 | 0 | Y | Y | S | Y | 0 | 0 | Y | Y |
| A.P.I. | S | S | 0 | 0 | S | Y | Y | Y | 0 | S | Y | |
| Black | S | Y | 0 | 0 | Y | Y | Y | Y | 0 | Y | Y | |
| Other | N | N | 0 | 0 | Y | Y | 0 | N | 0 | 0 | Y | Y |
| White | Y | Y | 0 | 0 | Y | Y | N | Y | Y | Y | ||
| <all> | Y | Y | 0 | 0 | Y | Y | Y | Y | Y | Y | ||
.
Happy Marriage
- Dad & Mom: You are right again and again!!!
- When you click on the "Happy Marriage" tab, you will see the following screen:
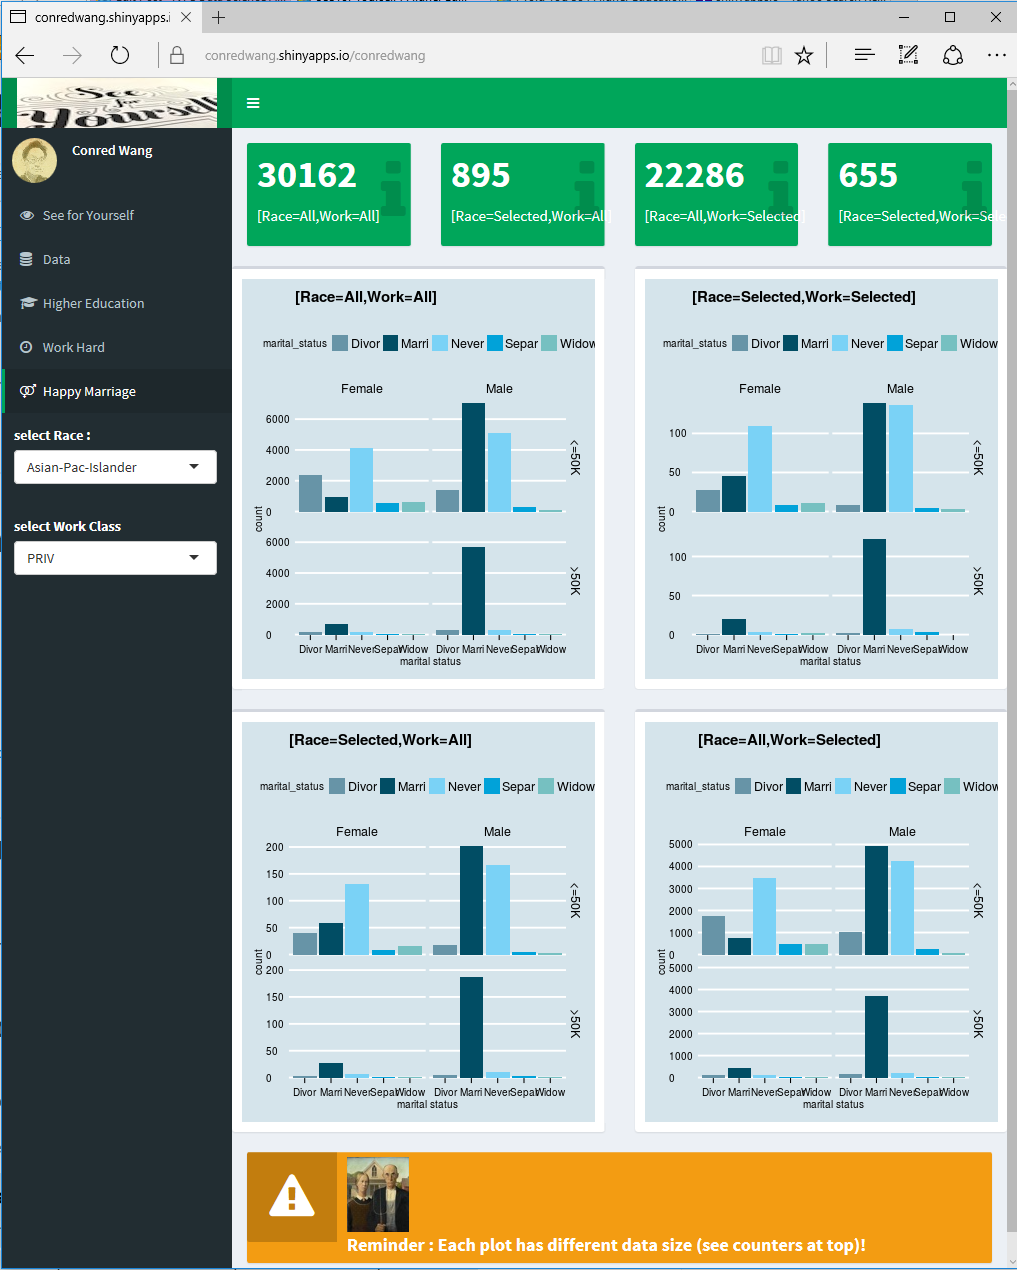
- As there are more "Y"(yes) than "N"(no) and "S"(same) combined, it indicates married people make more money than people with other marital status:
| work | GOV | NEVER | PRI | SELF | NOPAY | <all> | ||||||
| race | female | male | female | male | female | male | female | male | female | male | female | male |
| A.I.E. | Y | Y | 0 | 0 | Y | Y | Y | Y | 0 | 0 | Y | Y |
| A.P.I. | Y | Y | 0 | 0 | Y | Y | N | Y | 0 | Y | Y | |
| Black | Y | Y | 0 | 0 | Y | Y | Y | Y | 0 | Y | Y | |
| Other | Y | Y | 0 | 0 | Y | Y | 0 | Y | 0 | 0 | Y | Y |
| White | Y | Y | 0 | 0 | Y | Y | Y | Y | Y | Y | ||
| <all> | Y | Y | 0 | 0 | Y | Y | Y | Y | Y | Y | ||
.
Conclusion
For our last study I Told You So, we focused only on Asian adults (race) who worked in the private sector (work class), and we concluded:
Two out of three ain't bad, right? Marriage and education both appear highly related to income. However, "hard work" (i.e., length of hours worked) only appears related to income for males.
Using Shiny, our current study checked the myth/fact against all available races and work classes, and we concluded:
Higher Education (i.e. more years in education), Work Hard ( (i.e., length of hours worked) and Happy Marriage all appear highly related to higher income earning.
.
(end)