Taming News Flow
I was born and raised in India and moved to Canada when I was 19. Canada is one of most developed countries in the world. It is a sparsely populated, mature developed economy, mature democracy and a vibrant mix of different ethnicities. India, on the other hand, is a one of the most densely populated large countries in the world and one of the fastest growing major economies. It is also a young democracy and a young nation. Among other things, how these two nations saw the outside world left a marked impression on me and I always had a desire to investigate it further.
Viewpoints, I believe, are shaped as much by the information sources consumed by an individual as they are by priori believes. Our opinions, event knowledge and event interpretation are shaped by what we hear and read. These believes drive us to seek information with a particular bias creating a feedback loop. People with specific believes congregate and start forming (sub)cultures that start seeing the world through their own lens.
It is explainable when two nations on the opposite ends of majority of World Bank tables hold very different viewpoints about outside events. But it becomes perplexing when contrasting interpretations of real world events are held by people living in the same city, those living in the same neighborhood or ones living in the same household. Our lens is defined by whichever information loop we get stuck in. Seeking sources that invalidate our believes generates cognitive dissonance, and seeking sources that validate them stokes our ego via confirmation bias. News organisations are one of the strongest loop propagating mediums and are a perfect source for anyone looking for belief validation.
Being a budding data scientist in training, one simply cannot make statements without attempting to test their validity. As part of this project, I looked at different news sources and tested to see if they systematically bias news reports tried to measure it algorithmically. Questions I was trying to answer: Are there measurable differences between how events are covered by different news organizations? Do different organizations communicate a stronger positive or negative sentiment? Are they talking about different subjects and different people? As we shall see below, answer to all these questions is yes.
Given a short project completion time frame and limited resources, I selected my news sources where there were known biases. Further, I chose Donald Trump as the principal object and analysed news article that mentioned his name.
Given enough time and resources, I would have liked to scrape dozens of news sources from different countries. This would have been accomplished by collating articles written in native languages of different countries, translating them into English and comparing them to native English sources. This would have enabled me to quantitatively measure the bias in news sources by language and would have provided more data to establish differences. But this would have made this projects worthy of a PhD thesis not a 2-week mini-project.
On the advice of my TA and other people, I narrowed down the scope of the project to a few simple questions. (1) Find outlets that have opposite biases from each other. (2) Identify the sentiment they are communicating in the articles. (3) Find out what events and people they are talking about in conjunction with Donald Trump. I chose CNN and Fox as two organizations with opposing biases. Reuters was chosen as the neutral source. Please keep in mind that the main purpose of the project was to scrape data, clean it and present it graphically. This was not a statistical measurement or benchmarking of biases. I decided to take on the NLP portion because I was able to complete the scraping part ahead of schedule.
News articles were scraped for the week of Feb 5th - Feb 12th. This was a week before Michael Flynn stepped down from the position of National Security Adviser. All the articles were dispatched to Google Natural Language Processing API and Textrazor Natural Language Processing API for sentiment analysis.
Code Outline
Project code is parked here. Spiders were deployed in the cloud and scheduled to run every 8 hours. Scraping -
- Spider starts at the RSS of each news source.
- Clicks through each category and goes to the next page. This page lists of all the articles in this category published in the last 24 hours.
- On the article listing page, spider clicks on each article. This takes the crawling spider to the articles page.
- It keeps a track of all previously scraped pages and skips them.
- Spider copies the title, author, publication time and article text.
- A text processing pipelines sends this information to a database.
Sentiment and entity extraction -
- Connect and authenticate with all API’s.
- Download one article at a time from the database.
- Keep the article if it mentions the entity otherwise dump it and pull the next article.
- Clean the text for html tags, unwanted spaces and copyright/disclosure statements.
- Save the article in a JSON file using the hash function of article body as the file name.
- Check to make sure that this article has not been sent to the language API before.
- Send the article to language API#1.
- Collect API response and save it in the response data frame.
- Send the article to language API#2.
- Collect API response and append it to the response data frame.
- Write the response dataframe to response JSON file.
- Go to step 2 for the next article.
This a sample JSON file that includes the original article and NLP API responses from both the sources.
Data Analysis -
- Fetch all JSON files and extract the required information columns from them.
- Group as needed.
- Produce simple charts.
Results
As stated earlier, for the purpose of this project I narrowed down the analysis to a few specific questions. Let’s go through them one by one. Articles were only scraped for a period of 1 week and all the analysis represents that period.

Length of articles
CNN tends to write longer articles followed by Fox and Reuters.
I hypothesize that the articles written by Reuters are factual representations of actual events without any commentary or background and hence shorter that other sources. Many of the articles found on Reuters RSS feed represent pure reporting of events.
CNN articles tend to have a lot of html tags embedded in them. The lengths of the articles is calculated after removing these html tags.
How does the sentiment of different news sources compare to each other?
NLP sentiment analysis algorithms can classify if the attitude of the writer is positive, neutral or negative.
News sources generally tend to rely on large number of negative stories and some feel good stories to sell themselves. Articles not using either usually fail to sell.
This can be clearly seen when we compare the sentiment of stories published by all three sources. Stories are centered close to the middle but with a negative skew.
How does the magnitude of sentiment compare?
We see a fairly stark difference here. We saw in the last chart that overall sentiment of CNN articles is centered around the middle with a negative skew. The chart on right shows that whatever (negative) sentiment CNN is expressing, is being expressed forcefully. This means that they are writing opinionated articles.
Fox News comes in on the second place followed by Reuters. Articles from Reuters on average, do not express strong opinions which falls in line with the original hypothesis of factual reporting.
What entities and topics are news sources covering?
NLP algorithms can extract proper nouns (entity) from a given text. Main entity of an article can be defined as the object of an article. It could be a person, organisation or a legislative unit. Relevance of an entity to an article is defined by its salience score. Higher relevance produces a higher salience score. Topic of the article is categorized in a similar manner.
As the articles were selected based on presence of word Donald Trump, many of them had him as the entity with highest salience. Other entities usually had a lower salience score.
For this part of the analysis, I removed Donald Trump as the entity from the analysis data frame. This left all the other entities behind. These entities were relevant to that article and to him. I picked the top 5 entities in each article and collated them. Then I counted the number of articles for which each of these entities was in top 5. This gave me a list of 18-20 entities that each news source was talking about in conjunction with Donald Trump.

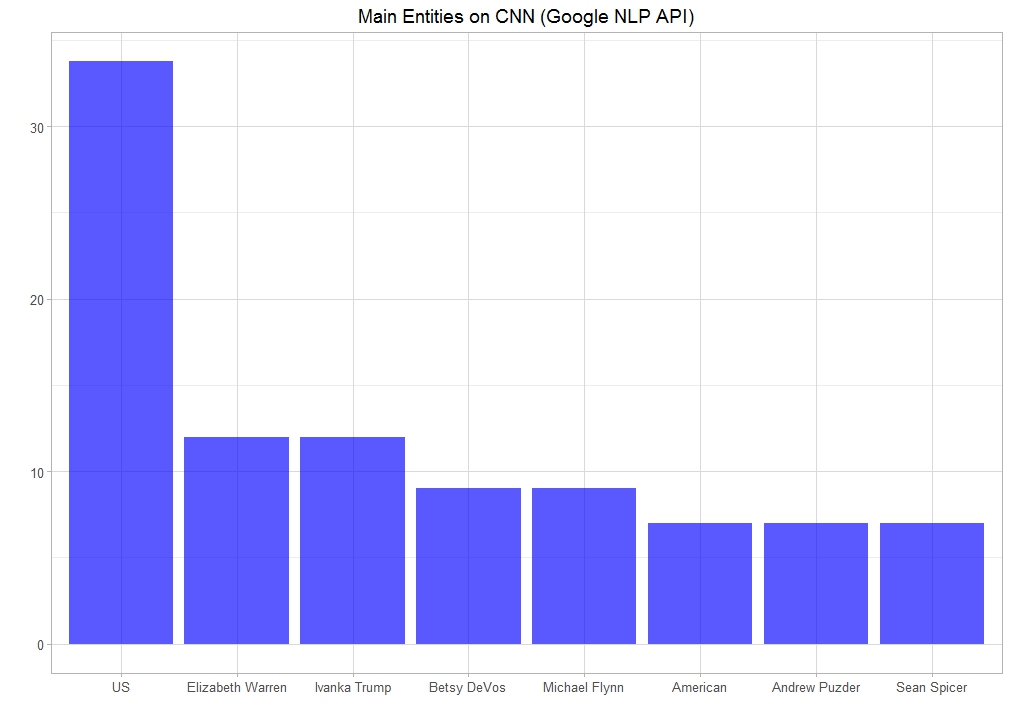
CNN
Entities most covered by CNN articles related to Donald Trump during this week were US, Elizabeth Warren, Ivanka Trump, Betsy Devos, Michael Flynn, Andrew Puzder and Sean Spicer. Anyone who follows the American politics would agree that the algorithm got it right. Many different politicians related to Donald Trump were in the news. This also shows that CNN was focused on covering people close to and opposing Donald Trump. Other countries or international leaders did not make it to the top of the list. Japanese prime minister Shinzo Abe was visiting US during this week but did not make it to the top of the list.
Topically, CNN focused on the US President, Senate, political  parties, illegal immigration, politics and Trump family.
Topical distribution means that the entities mentioned in the article were covered in the context of these broad conversations. This breakdown is consistent with the last part.
Looking at both entities and topics gives us a perspective about CNN's main areas of interest.
Fox News
Graph on the right shows that more Fox articles mentioned Betsy Devos than US (represents US, United States and United States of America). Republicans, Michael Flynn, Sean Spicer and Steve Bannon were the other entities consistently mentioned in articles.
Elizabeth Warren and Ivanka Trump were 2nd and 3rd entities for CNN but they did not make to the top 6 for Fox News. Steve Bannon makes it to the top 6 for Fox but was not in the CNN list.
Similarly, topical analysis also shows differences between both the  organisations. Fox seems to talk more about the Republican Party, politics and Supreme Court as compared to CNN. It is talking relatively less often about the US President and the Trump Family.
Here we start to see some more differences between CNN and Fox. These differences raise a lot of questions. Some of the unanswered questions I have are: Were Fox viewers more concerned about confirmation of Betsy Devos than CNN viewer? Is Supreme Court more important for the Fox viewers than CNN viewers? Is CNN disproportionately focused on the US President?
Reuters
As compared to CNN and Fox, Reuters is geared towards a global audience. This is clearly seen in the topics covered by them. During this week, Reuters was covering the Chinese, international leaders, comedians, Lady Gaga and the Supreme Court.
This is a clear departure from Fox News/CNN and gives a very clear indication that its articles are targeted towards a different audience.
Combined with neutral and low magnitude sentiment, Reuters stands out from the others.
Future
There are many obvious limitations associated with this project as implemented. This project was only meant to be a data collection and cleaning project. I was able to implement that part of the project fairly quickly and decided to take it a step further and incorporate NLP analysis.
Limited metrics were collected on original data. No analysis was performed to establish statistically significant differences between sentiments and topics covered by different companies.
Possibilities
This project provides a proof of concept for a large scale system and an anecdotal evidence that different news sources might be prioritizing different topics and entities. Visualizations also provide an anecdotal evidence that news sources may be introducing bias into reporting. Possibilities -
- Could be easily generalized to measure emotions prevailing in hundreds of sources. This would help get a real-time pulse on the news emotions of the world.
- Could be combined with viewership numbers to model the impact of breaking events.
- Incorporation of social media feeds.
- Resource for research into fake news and extreme ideologies. Tracking of hate speech on news sources and social media.
- Bigger net could be cast by incorporating audio, video news sources and YouTube videos using voice recognition capabilities of neural nets.
- Listening to public conversations at public places to gauge emotions. This would raise significant moral, ethical and legal hazards.
- NSA style phone call monitoring to thwart terrorist attacks.
Project code can be found here. Please get in touch with comments and feedback.
Tools Used
Python, PyCharm, JSON, Pandas, Scrapy, NLTK, Scrapinghub, Crawlera, Google Natural Language Processing API, Textrazor API, R, RStudio, Dplyr, Tidyr, Lubridate, Ggplot, JSONlite