Thinking outside the House: predicting Ames homes prices at the brink of the Great Recession
Abstract:
We set out to build a supervised machine learning model to accurately predict housing prices in Ames, Iowa.
Sections:
- EDA
- Preprocessing
- Modeling
Goal: Drawing on data from 2006-2010, we sought to develop a supervised machine learning algorithm to predict housing prices in light of the 2008 recession. Our process consisted of exploratory data analysis, feature engineering, pre-processing, model testing and validation.

EDA
As part of the Kaggle competition, we were given two datasets (train and test). Our training dataset consisted of 1459 rows and 80 columns with “sale price” as the target variable. We prepared the data in stages.
First, we split up the data into categorical and numerical variables. Then we further divided the categorical variables into ordinal (suggesting an ordered relationship, ex. “Overall rating from 1-10”) and nominal (no clear relationship).
Looking at the histograms allowed us to see the distributions of the variable values and alerted us to certain considerations. For instance, knowing variables were unevenly skewed helped us decide for which columns we could impute missing values with a mode or mean. Also, variables with a high degree of missingness let us know which columns could be dropped from the dataset.
We plotted a correlation matrix to better understand the relationship between various variables and see which ones could be the best indicators for ‘Sale Price,’ as well as which ones may be multicollinear in such a linear regression (to be seen later). Once we had explored our initial data, it was time to preprocess our data and see how we could create the best predictive model.
Thinking outside the house
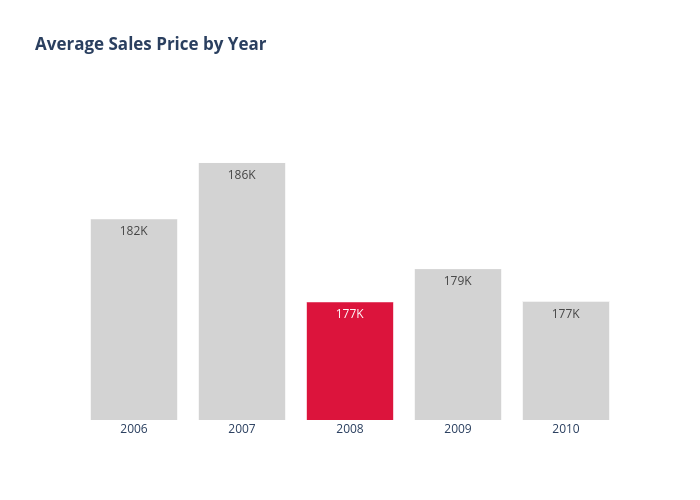
During the initial EDA phase, we observed that features included in our data set only described or measured a property’s characteristics. There were no outside factors included, such as external market forces, that could significantly influence the sale prices. The time period of data set covered was 2006 - 2010. In 2008, the average sale price of homes dropped by almost $10k. Average sale price of homes remained below $180k for rest of time period.
A major discussion within our group was how this time period coincides with two major events. The first event was the Housing Crisis in late 2007, which ultimately led to the second major event, the Great Recession in late 2008. Our general consensus was that we needed to somehow account for these events. We, ultimately, added two index measures that could account for any potential market volatility and inflationary risks: the VIX and CPI.
Why VIX? The VIX, also known as the ‘Fear Index’, is a measure of volatility in the general stock market. The figure actually represents the prediction of annualized change in the S&P 500 index in next 30 days based on the buy/sell activity of S&P 500 options. Analyst use VIX as a gauge of trader sentiment. Higher VIX figures, specifically greater than 20, coincides with a higher level of fear in the market.
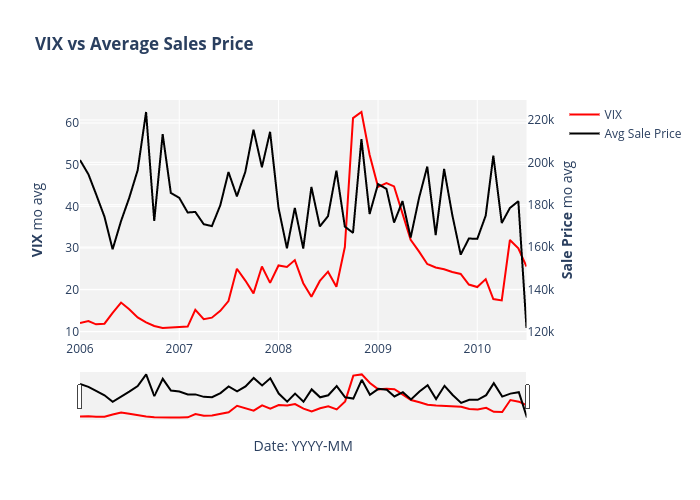
After adding VIX figures for time period covered, we found that VIX generally has an inverse relationship with the monthly average sale price of homes. Accordingly, VIX was an important consideration for our prediction models in the end.
Why CPI? CPI, or the Consumer Pricing Index, is a popular economic indicator used to identify the trend of inflation. Economists use the annual change in CPI as the inflation rate, which we wanted to account for in our model. Unfortunately, CPI didn’t show any significant relationship with housing prices and was, consequently, dropped from our final model.

Module:
We built our own pre-processing module (see our GitHub: https://github.com/michaelywang/Ames_House_Prices ) to do all the data processing to simplify
Numerical preprocessing
Missing Values
For Numerical variables, we imputed with the mean. For categorical variables, we imputed with the mode oftentimes, though there were few enough we could look specifically and fill in on a case-by-case basis.
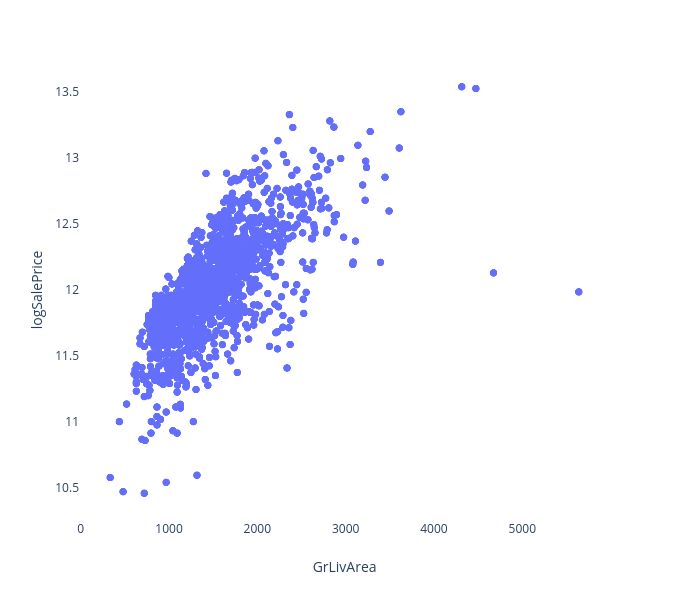
Log Transformation
We log transformed Sale Price because a linear model would work better if the Sale Price had a normal distribution.
Categorical preprocessing
Ordinal labeling
| NaN | Po | Fa | TA | Gd | Ex |
|---|---|---|---|---|---|
| None | Poor | Fair | Average | Good | Excellent |
| 0 | 1 | 2 | 3 | 4 | 5 |
When a categorical variable has a clear value order, we wanted to manually encode values for it. For features explaining quality, we encoded "None" as 0, "Poor" as 1, etc. up to "Excellent" as 6. The problem would be that the gaps between each are uncertain.
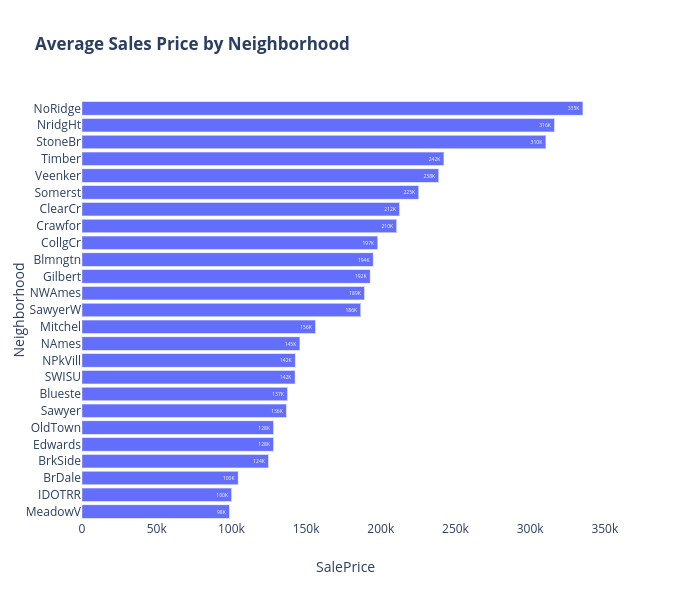
One Hot Encoding
| NoRidge | MeadowV | Gilbert |
|---|---|---|
| 1 | 0 | |
| 0 | 1 | |
| 0 | 0 |
Dummified columns (changed to binary yes no for each component) so they would have their own coefficient.
Testing
How did we find our optimum model?
We started with testing a multiple linear regression on our fully preprocessed data set to get an idea of performance and set a baseline to work off of. Without any transformations to the data, we wanted to see the coefficients that would have a significant impact on the sale price. As mentioned in our exploratory data analysis section, the sale price itself had a right skew. In anticipation that transforming our response variable would improve our model, we corrected for this skewness. That adjustment alone resulting in a.03 improvement in the test score.

Linear Regression
One key problem in creating an optimum predictive model is to account for multicollinearity. This occurs when two predictors are highly correlated with one another and introduce redundancy. That can lead to a higher R^2 score, though, in such cases, the data is being fit to noise rather than actual data.
Normalization
Additionally, in a linear regression model there is need for normalization so the scale of the units doesn’t exaggerate the effect of certain features in comparison to others. For example, if one feature is measured in inches and another in yards, the inch coefficient will be much smaller to compensate and thus this feature would have a lot smaller impact on the price prediction. Instead, we use normalization to make all the coefficients vary by their standard deviations from the mean. This allows us to use a proper multiple linear regression.
Regularized Regression
To simplify our model and see which features had the best predictive capability for sale price we used a series of penalized models to reduce variance (and thus the risk of overfitting) and increase bias to limit the effect of the features on sale price prediction. By doing so, we found that our best model was Lasso which dropped a number of features that did not correlate very strongly with sale price.
Briefly, the difference between the Lasso and Ridge models we tested was that the Lasso model will decrease coefficients all the way to zero (eliminating the impact of a feature on the predicted sale price) while Ridge would just decrease the coefficient to a very small scale but not eliminate any feature. Elastic Net served as a combination of the two and we wanted to try each combination to see which would give us the best overall result when compared to the kaggle test data set.
Cross-Validation
In order to properly tune our model, we sought out to find the most optimal hyperparameters(lambda/rho) that would be utilized in our penalized regression equation. A 5-fold cross validation was performed for Lasso, Ridge and Elastic Net to find the best hyperparameters that’ll eventually facilitate the model-selection process. We first iterated through a smaller range of values in order to not exhaust our computational resources, then further being more specific with our iterations to find the best hyperparameter.

Conclusion
How did we do on the Kaggle Score?
1 - R^2 (of our predicted Y vs. the True Test Y) = 0.127
indicating a 87% accurate prediction rate for sale price given these variables.
We found our best model used Lasso reducing our predictors to __ . We were quite impressed with the predictive capability of a “simple” model of regularized regression that performed as well or better than most of our peers that tried more complex models. This speaks to the fact that each data set should be observed on a case-by-case basis to find the best model for each situation. For future directions, we could test more measures of market features to see their impact on creating a more holistic understanding of the housing market.