Using Data to Analyze Home Renovations
Introduction
Investing in real estate can be an excellent way to make a profit. One way to increase the value of a home is to renovate, but often, homeowners spend a lot of money on renovations expecting to recoup more than they actually will. In reality some projects just offer better returns than others. In this text we will use data to analyze home renovations.
This return on investment depends on a myriad of conditions, some of which include: the type of renovation, the condition of the house (or part of the house), and location. Our purpose is to guide homeowners and house flippers through the difficult decision making process of deciding where to focus renovation efforts and budget by constructing an interpretable machine learning model to pinpoint the most profitable projects.
Background and Data
Professor Dean De Cock of Truman State University compiled a dataset looking at house prices in Ames, Iowa from 2006 to 2010. This dataset is often used for training in regression techniques and Kaggel competitions. Our data set contains 2,580 observations and 81 features, two of which differ from the Kaggle dataset: the target feature, Sales Price, and PID, a land parcel ID that can be used to find the property address and the long-lat coordinates of the houses using geopy.
Data Exploration
There are 80 columns in the dataset describing the house attributes range from location, quality, condition, basement information, garage information and so on. Since our target variable is the house price, we looked at its distribution:
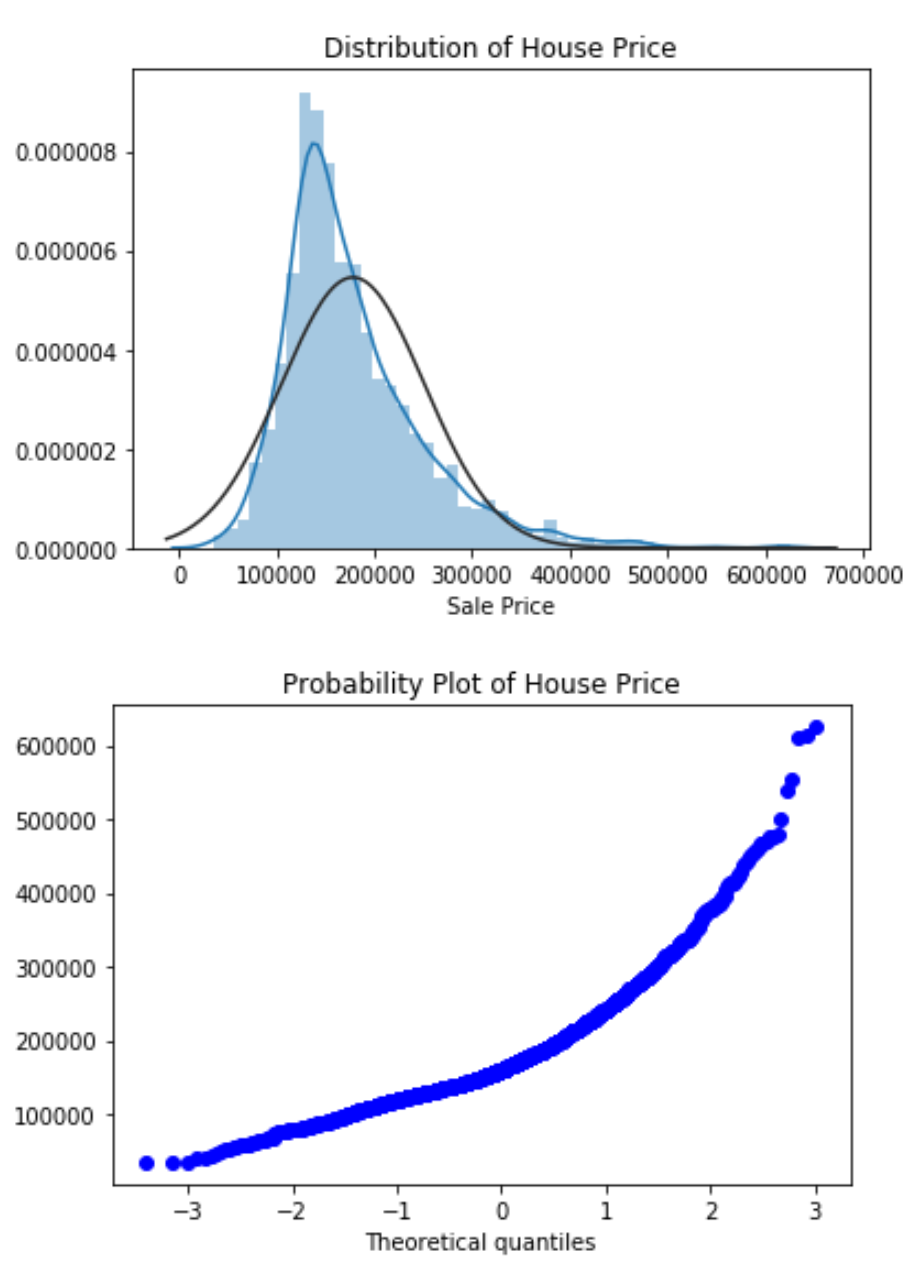
The distribution of the target feature, sales price is right skewed. As this violated the normality assumption for Multiple Linear Regression, we log transformed our target variable:

Data Cleaning
Many features contained missing values. Often this was linked to the absence of a house feature. For example any basement related values would be missing if the house did not have a basement. In these cases we imputed 0 for continuous features, and ‘None’ for categorical variables. Other missing data was not as frequent and seemed to be a case of missing completely at random, so we imputed the median or mode values.
Feature Engineering
Since the primary goal of our project is to build a machine learning model that can be easily interpreted to obtain insights for housing renovations, we wanted to keep the model simple as possible while still balancing the model predictive power. Feature engineering is an important step towards building streamlined models.
Ordinal Categorical Features:
There were 14 ordinal features in the original dataset rating the quality / condition of specific parts of the houses (e.g. excellent, good, average, fair, and poor). These were represented by strings, so we converted them to numeric values so that these features could be used in our linear regression models.
Continuous Features:
Then we reduced the number of continuous variables that expressed related or redundant information. For example, there were four variables related to bathrooms - Number of full baths, number of half baths, number of basement full baths, number of basement half baths - we combined these four variables into a single variable: total bathroom count. We also created a custom variable that reflected the ‘age’ of the house based on year built, year remodeled and year sold.
Lastly, we realized the variable GrLivArea (Above Ground Living Area) was the sum of three other existing variables (1stFlrSF, 2ndFlrSF, and LowQualFinSF). We decided to drop GrLivArea in favor of 1stFlrSF and 2ndFlrSF to avoid perfect multicolinearity and ran multiple linear regression on the 1st and 2nd floor features against our target features. We compared the resulting R^2 and decided to move forward with just 1stFlrSF, 2ndFlrSF by creating our custom variable log(1stFlrSF + 2ndFlrSF).
Categorical Features:
Through our exploratory data analysis, we looked into each of the categorical features to understand its relationship with our target variable log(SalePrice) and tried to reduce the number of factors within a given categorical variable. For example, there are 28 neighborhoods in the dataset, we simplified this feature by combining all neighborhoods into three tiers based on price/Sqft, illustrated below.
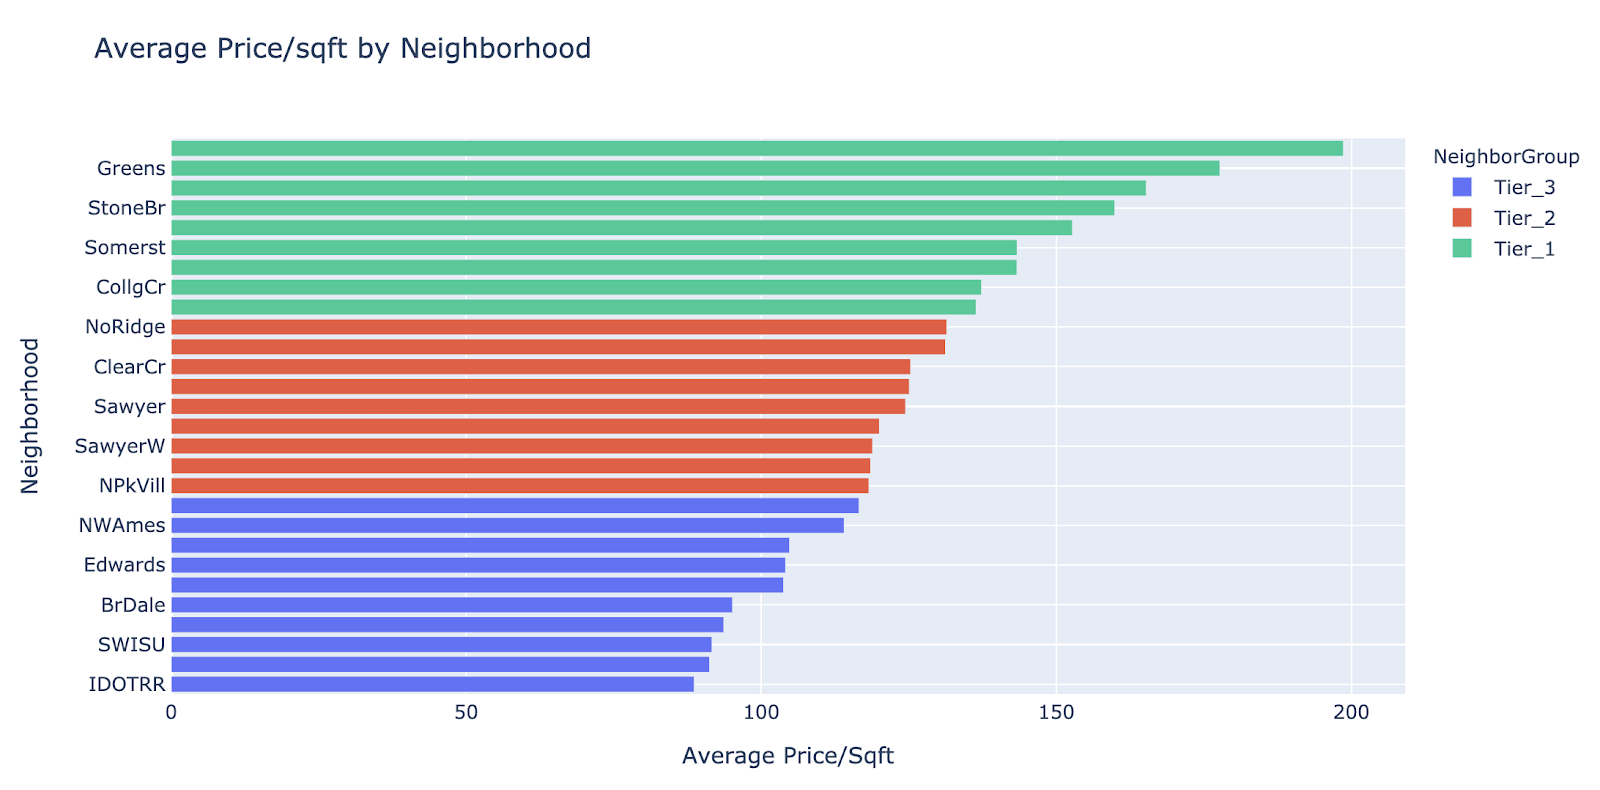
This strikes a good balance between reducing the complexity of our model while preserving the relevant location characteristics of neighborhoods. We performed similar data engineering on a few other categorical features such as House Types, Paved Drive, and Sales Conditions, binning similar categories together.
A Brief Note on Neighborhood Tiers
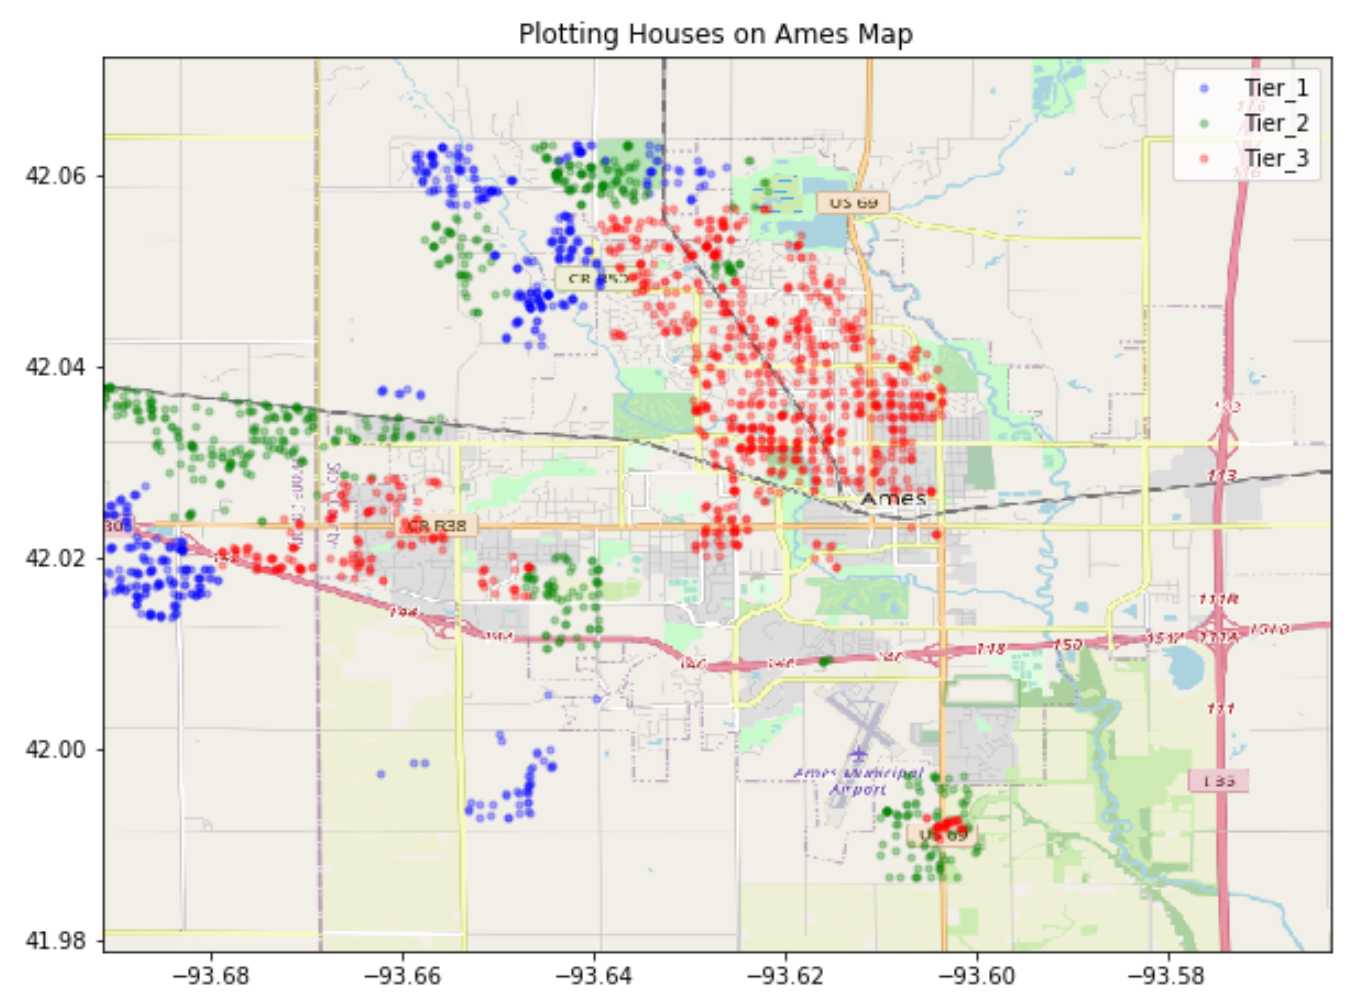
This graph shows how the three neighborhood tiers lay out geographically. We can see that the cheapest neighborhood houses (the red dots), tend to be near the downtown/ urban areas of Ames, whereas the more expensive neighborhoods (green and blue dots) are spread further into the suburb areas. After some investigation on Realtors.com, we found this pattern correlated with crime rates, where low priced neighborhoods tended to be areas with higher crime rates. Crime rate may be one of the external factors that influence house value that was not exposed in this dataset.
Models
We used Random Forest and BIC stepwise regression as a first round to roughly determine feature importance. We used these insights to inform another round of feature selection/engineering. For example, after looking at the VIF(variance inflation factor) of our forward BIC stepwise model, we examined features with high VIF scores and found the quality scores highly multicollinear.
We decided to omit overall quality due to this multicollinearity in favor of the individual quality scores. Square footage features also had high VIF scores, so we omitted the total square footage features and created a new feature that combined the 1st and 2nd floor square footage in its place.

We fit multiple models using different combinations of features that were both relatively important in LASSO and utilized in the stepwise regression. Then we compared these model’s cross validation scores and standard deviations, favoring the simplest model that kept our variables of interest with little comparative loss in R^2.
Conclusions and Business Recommendations
We wanted to provide a list of renovation suggestions not just based off of our model’s coefficients, but based off a relative return on specific renovations by including renovation costs. We pulled national averages for household renovations from homeavisor.com to estimate the relative costs of each type of renovation that could be done in these houses to improve home value.
Some renovation types represented below include total and partial renovations where a total kitchen renovation included hiring a designer, replacing countertops, sink, appliances, flooring and cabinets, while a partial kitchen renovation included replacing flooring and countertops.

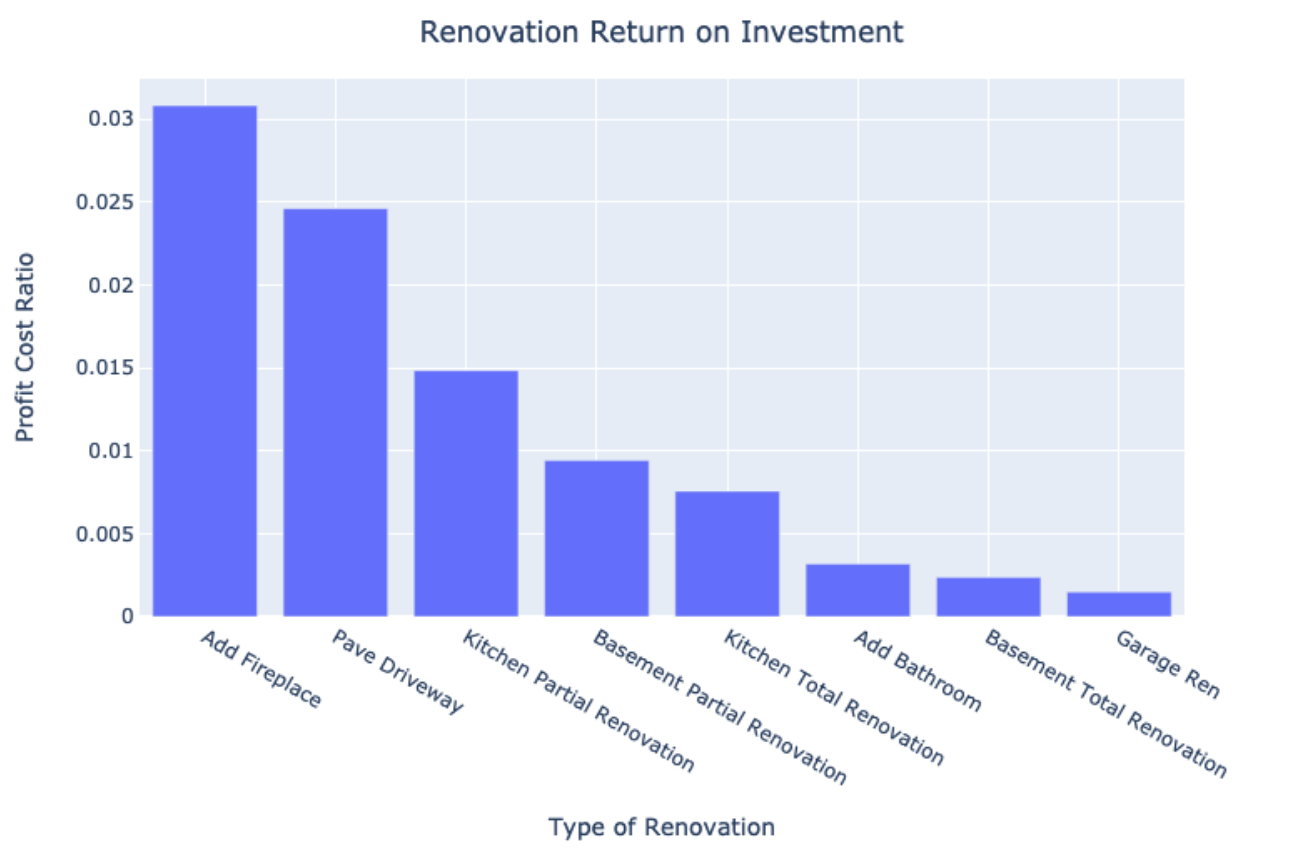
Our target region on this graph is the lower right corner, where the renovation not only potentially provides more value to the home based off of our model, but is also a relatively cheaper type of home renovation. These are the types of renovations we suggest prioritizing when renovating a home.
To better represent how we rank these renovations, we created a cost profit ratio by dividing the log increase in house price by the cost of renovation. Essentially, the larger the ratio, the better the potential return on investment. Adding a fireplace ranks highest, followed by paving a driveway if unpaved, and partially renovating a kitchen.
To explore price sensitivity of these renovations in different neighborhoods, we used the neighborhood tiers we engineered earlier to model and compare high, medium, and low mean price/sqft neighborhoods. Looking at the tiers one at a time, we suggest, if planning to flip a home or if intending to look for a home to invest in, consider homes with lower quality kitchens and unpaved driveways in tier 1 (high mean price/sqft) neighborhoods and renovate these features to get the greatest return on investment.
For tier 2 (medium mean price/sqft) neighborhoods(, consider houses with lower exterior quality and no fireplaces. Lastly in tier three (low mean price/sqft) neighborhoods, consider houses with low quality kitchens, no fireplaces or unpaved drives to make the most cost effective and profitable renovations.

Key Takeaways
Overall, disregarding location and neighborhood, our model suggests that the best way to increase home value in Ames, Iowa, is to build a fireplace, pave the driveway, or do moderate kitchen renovations .
When considering homes to invest in, look for houses with lower quality kitchens and unpaved driveways in more expensive neighborhoods, houses with no fireplaces in medium priced neighborhoods, and houses without fireplaces, unpaved drives, or lower quality kitchens in lower priced neighborhoods. These homes have the potential to give you better returns on your investment after some targeted renovations.
Contact Us
If you have any questions or comments, please feel free to reach out to any of us on LinkedIn or GitHub.
The skills we demoed here can be learned through taking Data Science with Machine Learning bootcamp with NYC Data Science Academy.