Examine "FAANG" stocks from the Nasdaq website. Analyze Short Interest, Institutional Ownership and Insider Trades

Posted on Aug 5, 2018

The Nasdaq website publishes information on stocks listed on it's exchange. The information includes fundamental categories like "Short Interest" and Holding categories like "Ownership Summary" and "Insider Trades." I have chosen to use Selenium to scrape the Nasdaq website. For this project, I will be examining the "FAANG" stocks listed on the Nasdaq. "FAANG" is a acronym for 5 of the most popular and best performing stocks: Facebook (FB), Amazon (AMZN), Apple (AAPL), Netflix (NFLX) and Google (GOOG). The growth of these high flying tech stocks have made it especially attractive for money managers to add these names in their portfolio's. Mandatory SEC 13-F filings give us a glimpse of who holds these stocks. On the other hand, we will also examine the Short Interest in these stocks, which shows investor sentiment of a stock and expect the shares to fall.

Short Interest

Short Interest is a bearish indicator for a stock made up of the number of shares sold short that have not yet been covered or closed out. It is calculated by looking at the "Days to Cover" (DTC) statistic as a judge for rising or falling sentiment for a stock on a bi-weekly basis. Firms are required to report their short positions as of settlement on the 15th of each month. A compilation is published 8 business days afterward on the NASDAQ website. Days to Cover is calculated as the aggregate short interest for the month divided by the average daily share volume traded between short interest settlement dates. NASDAQ provides a year's data of Short Interest. Scraping the table gives us the line graph below.

We can see that the DTC for each stock and how they've trended in the past year.


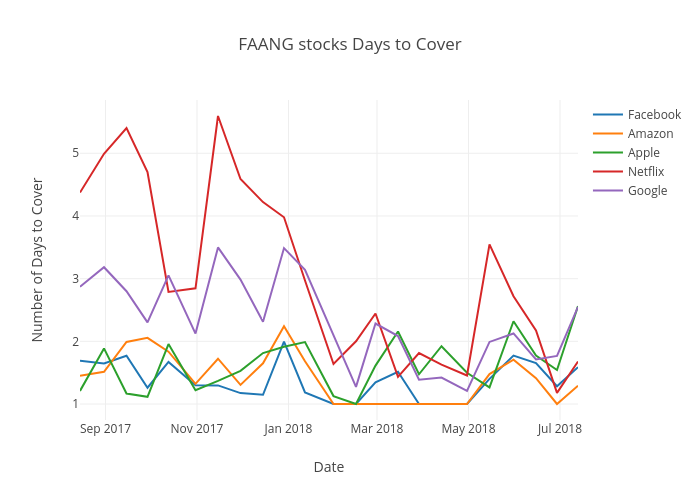
  • We can see Netflix DTC has come down from over 5 DTC in 4th quarter of 2017 to now under 2 DTC
  • Google exhibiting a similar pattern to Netflix, coming down from over 3 DTC to now and has recently spiked again 2.5 DTC
  • Apple DTC was in the 1 to 2 day band, now spiking to 2.5 DTC
  • Amazon and Facebook DTC in the 1 to 2 day band

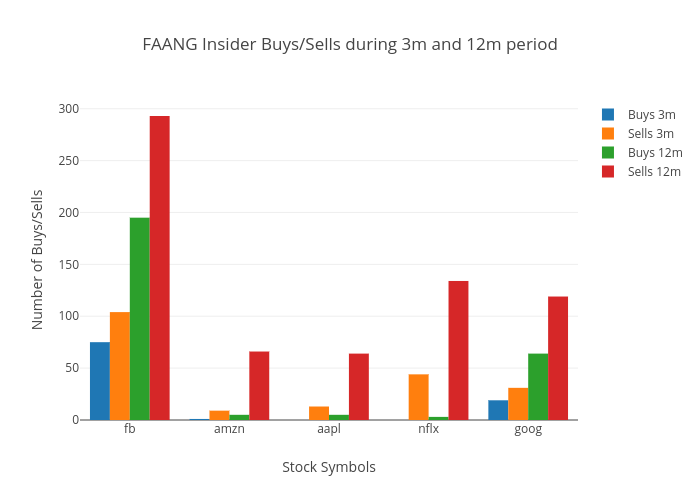
This table shows the number of buys/sells for the past 3 months and number of buys/sells for the past 12 months from insiders. We can see for FB, that the number of sells outweighed the number of sells in both the past 3months and 12months. To get a better picture of the amount of share activity, please refer to the chart below.


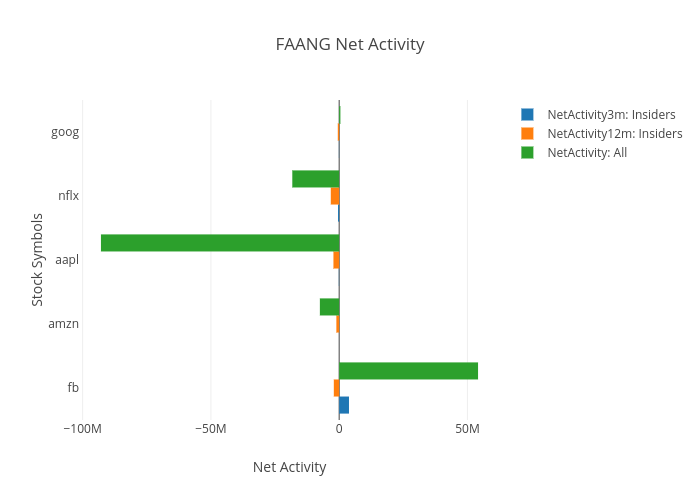
This table shows the net activity in shares. The blue and orange bars show the total amount of shares brought and sold by insiders in the past 3months and 12 months respectively. The green bar shows the total amount of shares brought and sold by Institutional Holders over the past year. Apple stands out from the other stocks in this bar graph as, Institutions have sold over 90m shares of the company over the past year.


Ownership Information

NASDAQ shows ownership information from institutions and the below picture shows the percentage that Institutions hold, the number of holders, the number of shares and the value of the holdings.

We can also see the top five holders and the numbers of shares of each stock listed on the NASDAQ.

Conclusion: Trends in Short Interest, Ownership Activity and Insider Trades can show you more factors to apply to the analysis on your stock. That could help you make better-informed decisions about buying or selling at particular points in time.

About Author

Howard Chang

Howard is currently a NYC Data Science Academy Fellow with a MS in Applied Math and Statistics from Stony Brook University. He has work experience in Portfolio Finance and Margin at a billion dollar multi-strategy hedge fund and...
View all posts by Howard Chang >

Leave a Comment

No comments found.

View Posts by Categories


Our Recent Popular Posts


View Posts by Tags

#python #trainwithnycdsa 2019 2020 Revenue 3-points agriculture air quality airbnb airline alcohol Alex Baransky algorithm alumni Alumni Interview Alumni Reviews Alumni Spotlight alumni story Alumnus ames dataset ames housing dataset apartment rent API Application artist aws bank loans beautiful soup Best Bootcamp Best Data Science 2019 Best Data Science Bootcamp Best Data Science Bootcamp 2020 Best Ranked Big Data Book Launch Book-Signing bootcamp Bootcamp Alumni Bootcamp Prep boston safety Bundles cake recipe California Cancer Research capstone car price Career Career Day citibike classic cars classpass clustering Coding Course Demo Course Report covid 19 credit credit card crime frequency crops D3.js data data analysis Data Analyst data analytics data for tripadvisor reviews data science Data Science Academy Data Science Bootcamp Data science jobs Data Science Reviews Data Scientist Data Scientist Jobs data visualization database Deep Learning Demo Day Discount disney dplyr drug data e-commerce economy employee employee burnout employer networking environment feature engineering Finance Financial Data Science fitness studio Flask flight delay gbm Get Hired ggplot2 googleVis H20 Hadoop hallmark holiday movie happiness healthcare frauds higgs boson Hiring hiring partner events Hiring Partners hotels housing housing data housing predictions housing price hy-vee Income Industry Experts Injuries Instructor Blog Instructor Interview insurance italki Job Job Placement Jobs Jon Krohn JP Morgan Chase Kaggle Kickstarter las vegas airport lasso regression Lead Data Scienctist Lead Data Scientist leaflet league linear regression Logistic Regression machine learning Maps market matplotlib Medical Research Meet the team meetup methal health miami beach movie music Napoli NBA netflix Networking neural network Neural networks New Courses NHL nlp NYC NYC Data Science nyc data science academy NYC Open Data nyc property NYCDSA NYCDSA Alumni Online Online Bootcamp Online Training Open Data painter pandas Part-time performance phoenix pollutants Portfolio Development precision measurement prediction Prework Programming public safety PwC python Python Data Analysis python machine learning python scrapy python web scraping python webscraping Python Workshop R R Data Analysis R language R Programming R Shiny r studio R Visualization R Workshop R-bloggers random forest Ranking recommendation recommendation system regression Remote remote data science bootcamp Scrapy scrapy visualization seaborn seafood type Selenium sentiment analysis sentiment classification Shiny Shiny Dashboard Spark Special Special Summer Sports statistics streaming Student Interview Student Showcase SVM Switchup Tableau teachers team team performance TensorFlow Testimonial tf-idf Top Data Science Bootcamp Top manufacturing companies Transfers tweets twitter videos visualization wallstreet wallstreetbets web scraping Weekend Course What to expect whiskey whiskeyadvocate wildfire word cloud word2vec XGBoost yelp youtube trending ZORI