What's the value of a college degree?
Shortly after commencing this immersive boot camp, I couldn't help but remark on the fact that everyone in my cohort has at least a bachelor's degree, and a huge chunk of us have graduate degrees as well; yet here we all were, investing a significant amount of time and money into obtaining new, more marketable skills than the ones with which we left University. Regardless of the degree(s) we have, and regardless of how we want to use data science in our careers, the common thread here is that our college education alone didn't quite enable us to achieve the success we wanted for ourselves. I believe most of my peers were told that a college degree is a requirement for a stable, lucrative career, but does the data back that up?
Is a college degree still a wise investment?
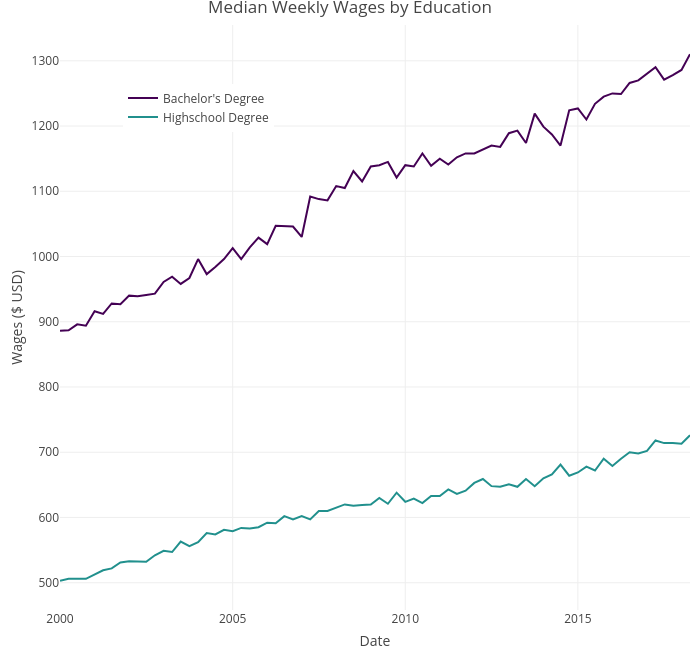
One of the major draws of pursuing higher education in our society is the promise of higher wages compared to only having a high school degree. First, I looked at the median weekly wages for different levels of education from the Federal Reserve Economic Data. From a simple line chart, it's clear that in 2018, people with at least a bachelor's degree make almost twice as much as those with a high school degree.
Okay great, this is exactly why my parents always encouraged college. However, their generation was not burdened with skyrocketing tuition, and thus they were not forced to take on substantial amounts of debt relative to what students have to deal with today. I next looked at consumer price index (CPI) data from the Bureau of Labor Statistics to get a feel for just how much college tuition has risen in recent years.
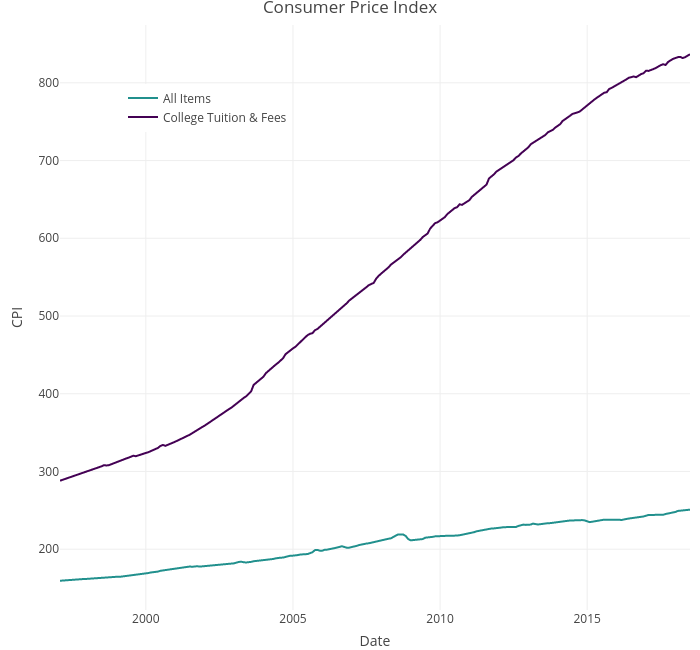
Yikes! While the CPI for all items increased by about 50% since 1997, CPI for college tuition and fees nearly tripled. Even though the so-called "college wage premium" is significant, rising tuition costs have started to undermine this. To further explore, I looked at outstanding student loan debt balance per capita from the Federal Reserve Bank of New York.
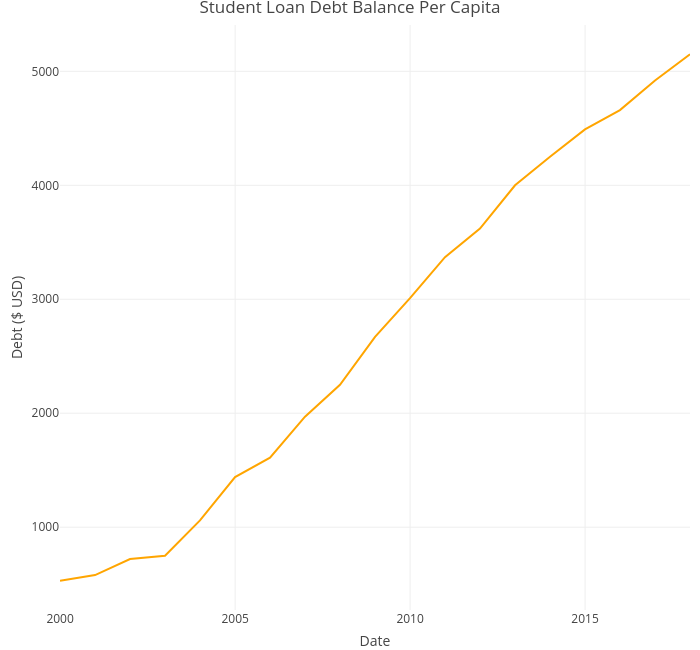
What used to be around $500 of student loan debt per person in 2000 is now over $5,000 in 2018. Although I didn't perform concrete statistical analysis on any of the data presented thus far, these visualizations helped me establish:
- Going to college will still get you consistently higher wages, and the wages rise at a similar rate to wages for those with a high school degree.
- One cannot only think about the promise of higher wages when deciding to get a bachelor's degree; college is much more expensive than it once was, and this is reflected in the huge increase in personal debt burden.
Major Matters
Even though there are more financial drawbacks of getting a bachelor's degree than there were even 20 years ago, many people still elect to make the investment. After my exploratory data analysis, an interesting finding from a Georgetown study caught my eye:
"Over a lifetime, the average difference between a high school and college graduate’s wages is $1 million, but the difference between the lowest-and the highest-paying majors is $3.4 million."
In order to further investigate the difference in earnings by major, I gathered data from the US Census American Community Survey 5-year estimate from 2012-2016. Below is a boxplot of all different categories of majors and their respective annual wages.
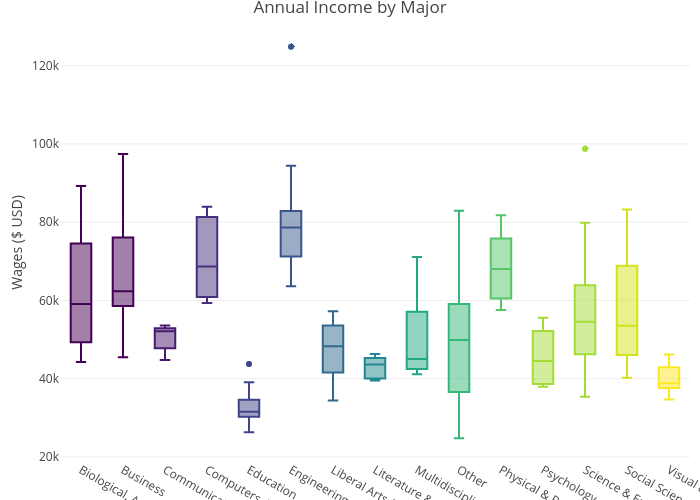
Engineering majors have the highest median salary by far, along with business and computers/mathematics. Education , visual/performing arts, and literature/language majors have the lowest salaries. While these findings aren't particularly surprising, this visualization reinforces the fact that major matters. If you're thinking about investing in a bachelor's degree or higher, you're going to get the most value for your degree if you choose a STEM major.
College Finder Application
Great, so now that we've established that a college degree is still highly valuable in this society, even with the rising cost, and that one will get more value out of that degree if they choose their major wisely, it's time to find a college that fits our criteria!
I developed a Shiny application that allows one to

This app was inspired by Rstudio's ZipExplorer. The user can explore all 4-year colleges in the US that have bachelor's degree programs. While there are other similar apps out there, I couldn't find one that allows the user to filter schools by the majors they offer. After concluding that the major one chooses will have a huge impact on the outcomes of the bachelor's degree, the ability to filter by major seems to me to be the most important part of a college explorer app! I constructed this map using the US Department of Education's 2017 College Scorecard data set, which has a robust amount of information for every college in America. For my app, I decided to include the ability to filter schools by:
- Type (public vs. private non-profit vs. private for-profit)
- Undergraduate student body size
- Average out-of-state tuition & fees
- Median student loan debt upon completion of a bachelor's degree
- Median earnings six years after entering college for students who obtained a bachelor's degree
- Campus setting (locale)
- Admission rate
- 25th percentile SAT and ACT scores
- Majors offered
When the user clicks on a marker, a popup appears with even more relevant information about the school, including religious affiliation or special interest (e.g. HBC, women-only). The data explorer tab takes the same user input as the map and displays a data table with the schools matching the user's selection criteria. The user can also search schools by state and city. The last tab merely displays the plot.ly graphs I generated for my exploratory data analysis.
Shiny Code
First, I had to clean my dataset. Using the College Scorecard data, I manually selected and renamed columns of interest - using the dplyr package - paring it down from a few hundred variables to 78 variables. I also filtered out any college that didn't offer a 4-year bachelor's degree program. I saved this data frame to a csv file, primarily so that my application doesn't have to process extraneous data, which would slow down its responsiveness significantly. This "custom" data frame is the one I use to build my app.
My code is set up so that the server.R function in the Shiny app creates a data frame that reacts to the user inputs in the ui.R function. Again, I use dplyr to generate these filters within a reactive function in the server code; the reactive function returns a filtered data frame, which can then be fed as input to an observer that renders the map. The map is drawn using a leaflet function, and the markers on the map are plotted with leafletProxy; it is inside an observe function, which by nature re-executes the proxy each time the data inputs change. This way, the map is rendered only once, and the markers are plotted quickly whenever the filters are changed. You can find my source code on my Github.
Conclusions
The goal of this project was to explore some of the main monetary factors that affect the value of a college degree, to determine criteria that would help someone get more value out of going to college, and then to build an app that facilitates the college selection process with emphasis on the aforementioned criteria. The decision to invest in a college degree is riskier than it once was, but one can mitigate some of that risk by choosing a major that will earn a higher salary. Then, they can use my app to help decide what school will be the best fit and so that they can invest their money wisely!
This was a great first foray into R and Shiny, and my goal is to continue adding filters and selection criteria to the app so that it can be even more helpful to students trying to choose a college.