NYC Data Science Academy| Blog
Bootcamps
Lifetime Job Support Available Financing Available
Bootcamps
Data Science with Machine Learning Flagship ๐Ÿ† Data Analytics Bootcamp Artificial Intelligence Bootcamp New Release ๐ŸŽ‰
Free Lesson
Intro to Data Science New Release ๐ŸŽ‰
Find Inspiration
Find Alumni with Similar Background
Job Outlook
Occupational Outlook Graduate Outcomes Must See ๐Ÿ”ฅ
Alumni
Success Stories Testimonials Alumni Directory Alumni Exclusive Study Program
Courses
View Bundled Courses
Financing Available
Bootcamp Prep Popular ๐Ÿ”ฅ Data Science Mastery Data Science Launchpad with Python View AI Courses Generative AI for Everyone New ๐ŸŽ‰ Generative AI for Finance New ๐ŸŽ‰ Generative AI for Marketing New ๐ŸŽ‰
Bundle Up
Learn More and Save More
Combination of data science courses.
View Data Science Courses
Beginner
Introductory Python
Intermediate
Data Science Python: Data Analysis and Visualization Popular ๐Ÿ”ฅ Data Science R: Data Analysis and Visualization
Advanced
Data Science Python: Machine Learning Popular ๐Ÿ”ฅ Data Science R: Machine Learning Designing and Implementing Production MLOps New ๐ŸŽ‰ Natural Language Processing for Production (NLP) New ๐ŸŽ‰
Find Inspiration
Get Course Recommendation Must Try ๐Ÿ’Ž An Ultimate Guide to Become a Data Scientist
For Companies
For Companies
Corporate Offerings Hiring Partners Candidate Portfolio Hire Our Graduates
Students Work
Students Work
All Posts Capstone Data Visualization Machine Learning Python Projects R Projects
Tutorials
About
About
About Us Accreditation Contact Us Join Us FAQ Webinars Subscription An Ultimate Guide to
Become a Data Scientist
    Login
NYC Data Science Acedemy
Bootcamps
Courses
Students Work
About
Bootcamps
Bootcamps
Data Science with Machine Learning Flagship
Data Analytics Bootcamp
Artificial Intelligence Bootcamp New Release ๐ŸŽ‰
Free Lessons
Intro to Data Science New Release ๐ŸŽ‰
Find Inspiration
Find Alumni with Similar Background
Job Outlook
Occupational Outlook
Graduate Outcomes Must See ๐Ÿ”ฅ
Alumni
Success Stories
Testimonials
Alumni Directory
Alumni Exclusive Study Program
Courses
Bundles
financing available
View All Bundles
Bootcamp Prep
Data Science Mastery
Data Science Launchpad with Python NEW!
View AI Courses
Generative AI for Everyone
Generative AI for Finance
Generative AI for Marketing
View Data Science Courses
View All Professional Development Courses
Beginner
Introductory Python
Intermediate
Python: Data Analysis and Visualization
R: Data Analysis and Visualization
Advanced
Python: Machine Learning
R: Machine Learning
Designing and Implementing Production MLOps
Natural Language Processing for Production (NLP)
For Companies
Corporate Offerings
Hiring Partners
Candidate Portfolio
Hire Our Graduates
Students Work
All Posts
Capstone
Data Visualization
Machine Learning
Python Projects
R Projects
About
Accreditation
About Us
Contact Us
Join Us
FAQ
Webinars
Subscription
An Ultimate Guide to Become a Data Scientist
Tutorials
Data Analytics
  • Learn Pandas
  • Learn NumPy
  • Learn SciPy
  • Learn Matplotlib
Machine Learning
  • Boosting
  • Random Forest
  • Linear Regression
  • Decision Tree
  • PCA
Interview by Companies
  • JPMC
  • Google
  • Facebook
Artificial Intelligence
  • Learn Generative AI
  • Learn ChatGPT-3.5
  • Learn ChatGPT-4
  • Learn Google Bard
Coding
  • Learn Python
  • Learn SQL
  • Learn MySQL
  • Learn NoSQL
  • Learn PySpark
  • Learn PyTorch
Interview Questions
  • Python Hard
  • R Easy
  • R Hard
  • SQL Easy
  • SQL Hard
  • Python Easy
Data Science Blog > Data Visualization > Factors That Relate to Body Mass Index

Factors That Relate to Body Mass Index

ziqipolimeros@gmail.com
Posted on May 26, 2022

FHV

[13]

Introduction
Data Sources and Methods
Feature Selections and Data Cleansing
Data Analysis and Visualization

Discussion 1
Discussion 2
Discussion 3
Discussion 4

Summary
References

Introduction

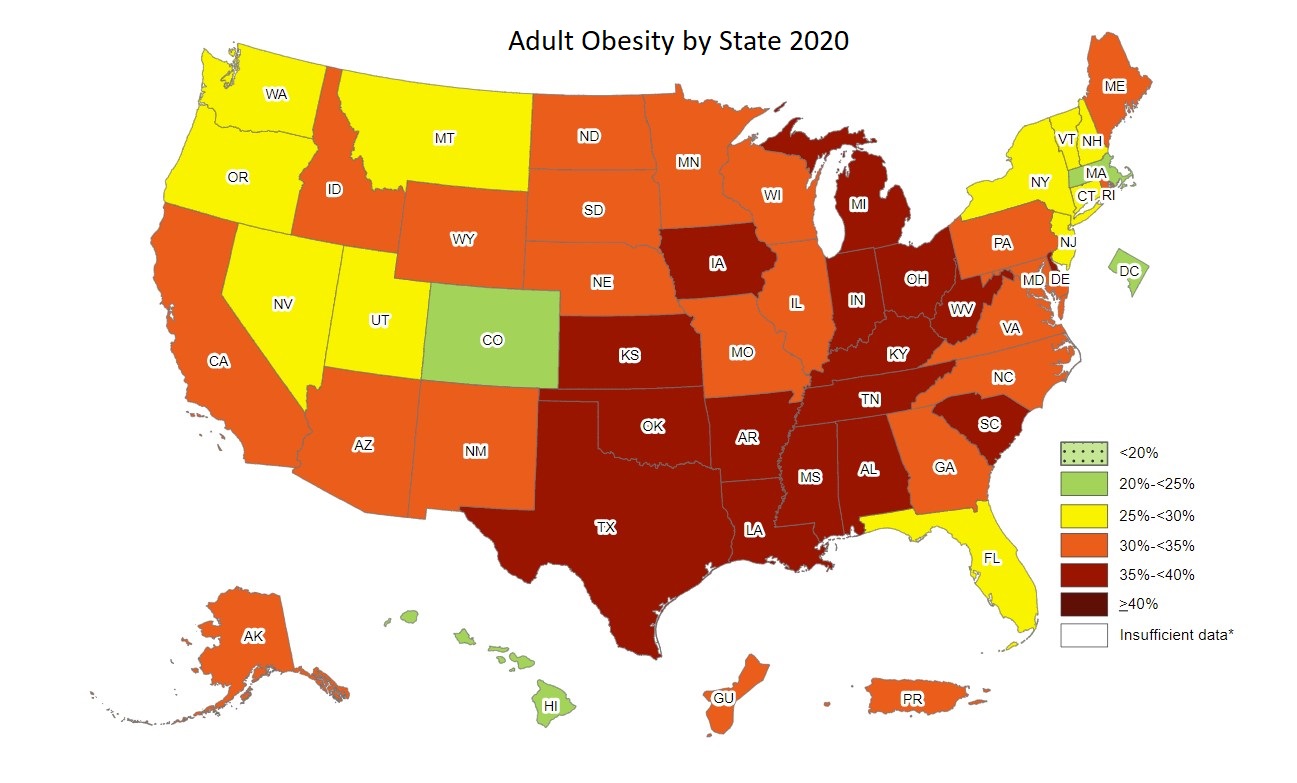
The problem of obesity has increased significantly in this century. In the United States, obesity grew from 30.5% to 42.4% and severe obesity jumped from 4.7% to 9.2% from 1999 to 2018,[1] as indicated by increased body mass index(BMI) in the population.
That poses a serious health risk in light of the fact that
obesity is correlated with various diseases, such as high blood pressure, diabetes, heart attacks etc. To address the health risk, we have to look at the causes of high BMI and what we can do to prevent obesity. To that end, we searched the internet for information and found the National Health and Nutrition Examination Survey (NHANES).[2]

NHANES is an annual survey taken by the Centers for Disease Control and Prevention(CDC). The survey is a program that is designed to assess the health and nutritional status of adults and children in the United States. The program takes a nationwide sample of about five thousand persons each year. Data collected includes demographics, dietary and health related questions and laboratory tests results. Analysis from the survey can be used to determine the risk factors for diseases.

Data Sources and Methods

For this project, we used NHANES 2017 - March 2020 Pre-Pandemic Data[3] There are 82 data sets in the survey. Most of the data sets have about 15 thousand observations and dozens of features. We chose blood pressure, blood glucose, insulin and cholesterol data sets as known factors to examine our methods. We chose diet behavior data sets from NHANES 2011, 2013, 2015 and NHANES 2017 - March 2020 Pre-Pandemic Data as unknown factors to analyze.

There are two main methods in the project.


  • Body Mass Index(BMI)


$BMI = 703*\frac{weight(lb)}{[height(in)]^{2}}$     [4]

As you can see, BMI is based on two simple factors - height and weight. It's a crude method to roughly estimate body fat. It's not suitable for athletes who might have high BMI with normal body fat or very little body fat. However, "BMI is commonly used by doctors to screen for health problems stemming from weight issues".[5] In this project, we still used BMI to indicate body fat and classify overweight and obesity.


  • Correlation Coefficient

Correlation coefficients are used to measure the strength of a relationship between two variables.[6] The value of correlation coefficient, r range between -1 and +1. The table below shows that the relationship between two variables based on the value of r:


Absolute value of r Strength of relationship
r < 0.25 No relationship
0.25 < r < 0.5 Weak relationship
0.5 < r < 0.75 Moderate relationship
r > 0.75 Strong relationship

[7]

Feature Selections and Data Cleansing

Our original data sets had missing information. We chose features with minimal missing data. As more features were added, the data set became smaller and smaller. The indicators of relationships between BMI and laboratory features changed alightly, but the indicator of BMI and age changed dramatically. We tried different approaches and addressed the problem.

Data Analysis and Visualization

Body Measures


There is a children's BMI category feature in the data, but no adult BMI category. The method we used to classify adult BMI is from National Heart, Lung, and Blood Institute.[8]

Demographics


We chose seven features, including age, gender, race, marital, and education.

FHV


Discussion 1


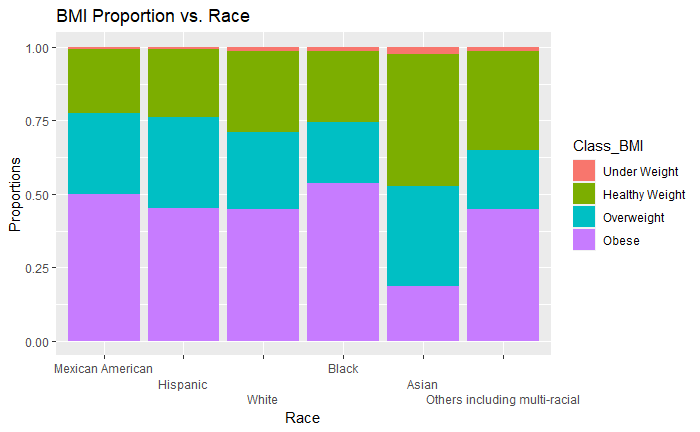
Asian group is very prominent in the graph.
The percentage of obesity is lower than 25% in the Asian group while around 50% in other races. Also, the percentage of healthy weight in Asian group is about two times of other race groups.
Are Asians healthier than other race groups? Some Asian Americans are in normal weight range, but have less muscle and more body fat.[9] That's another factor that impact the accuracy of BMI.

Insulin and Blood Glucose


We created a new feature, diabetes that is based on blood glucose.[10]
We also apply the same method on it.
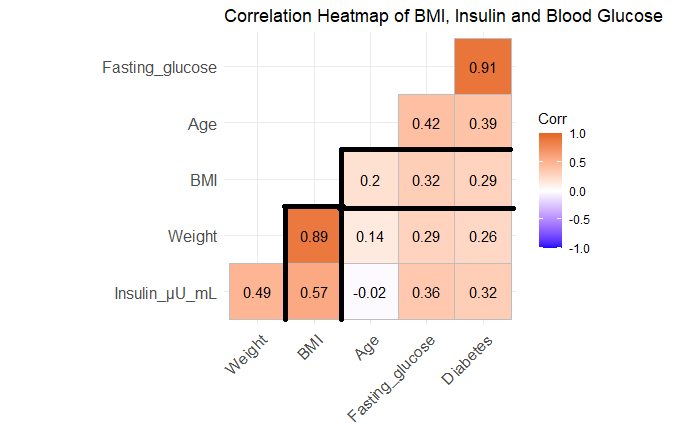
FHV


Discussion 2


The graph shows that there's a moderate relationship between BMI and Insulin. But blood glucose and diabetes have a weak relationship with BMI. However, the indicator of relationship between BMI and age is 0.2 which means there's no relationship!
We didn't know what's wrong. In this data set we only dropped some missing values, which is the requirement of performing the method. We wanted to find another material to do the analysis, but it's really difficult to find a data set that contains such comprehensive information and detailed explanation of features. We continued the analysis and hoped the problem can be avoided or addressed.

Total Cholesterol, High Density Cholesterol and Blood Pressure


We added a new feature, cholesterol ratio.[11] In the Blood Pressure data set, both systolic and diastolic were taken three times. We took the average values of each.

FHV

Discussion 3


From the graph you can tell that BMI has a weak relationship with cholesterol ratio and blood pressure. But even more bizarre, the indicator of relationship between BMI and age soared from 0.2 to 0.34. Since these are laboratory and examination data, we didn't over-process the data. The big change was dropping missing values. Is this the problem? We decided to add more observations and see what the result will be.

Diet Behaviors


As we mention before, we chose NHANES 2011, 2013, 2015 and NHANES 2017 - March 2020 Pre-Pandemic Data to analyze diet behaviors.

FHV


Discussion 4


In this sample, we examine ten diet behaviors, which included the following:

    1. How healthy is your diet?
    1. How much milk did you consumed in the past 30 days?
    1. How many not-home-prepared meals did you consume in the past seven days?
    1. How many of your meals in the past seven days were from fast food or pizza place?
    1. How many of your meals in the past 30 days were from grocery stores(Ready_to_eat_foods)?
    1. How many frozen meals/pizzas did you consume in past 30 days?

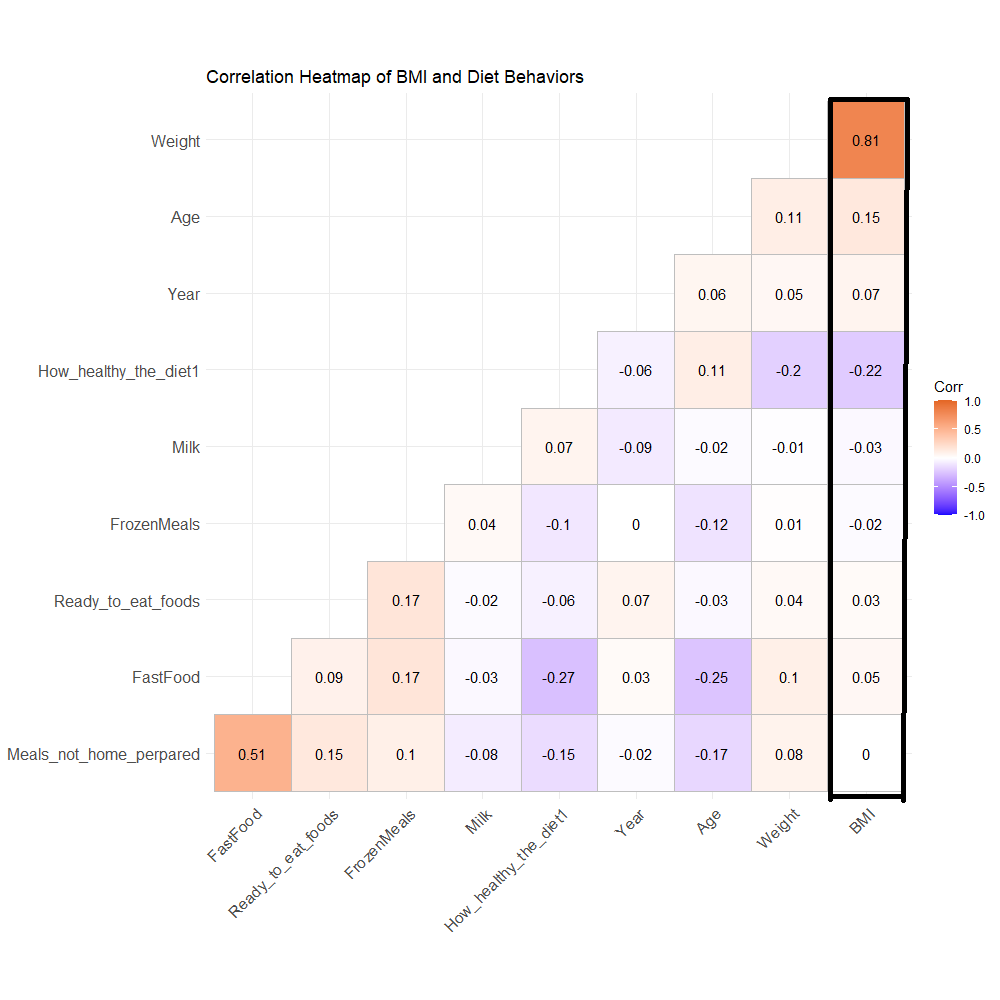
From the heatmap you can tell that most of the indicators of these factors are close to zero. The lowest number is from "How healthy is your diet", negative 0.22, which still considered no relationship. We couldn't find any relationship between BMI and the diet behaviors above.

As we all know that what we eat and drink directly impact our weight. Before analyzed the dataset, we expected to build a predictive model based on some diet behaviors. However, we couldn't find any proof that the diet behaviors from NHANES impact BMI. We are of the opinion that those questions didn't relate to body weight. If we want to measure the relationship between BMI and diet behaviors, we need to ask specific questions, such as the proportion of protein or carbohydrate in your diet, how much calories do you consume daily, when do you have breakfast or dinner, etc.

In this graph, the correlation coefficient between age and BMI is 0.15. Since itโ€™s from a bigger dataset, which combined four datasets, we believe that 0.15 is more accurate. Previous correlation heat maps were from different subsets, that joined insulin or blood pressure, which makes the subsets bias.

Summary

table, th, td {
border: 1px solid white;
border-collapse: collapse;
}
th, td {
background-color: #F7F0E5;
}

Factors Correlation Coefficient with BMI Strength of relationship
Weight 0.81 or 0.9 Strong relationship
Age o.15, 0.2 or o.34 No relationship or Weak relationship
Blood glucose 0.32 Weak relationship
Insulin 0.57 Moderate relationship
Diabetes 0.29 Weak relationship
Cholesterol ratio 0.4 Weak relationship
Systolic 0.27 Weak relationship
Diastolic 0.4 Weak relationship
How healthy is your diet? -0.22 No relationship
How much milk did you consumed in the past 30 days? -0.03 No relationship
How many not-home-prepared meals did you consume in the past seven days? 0 No relationship
How many of your meals in the past seven days were from fast food or pizza place? 0.05 No relationship
How many of your meals in the past 30 days were from grocery stores(Ready_to_eat_foods)? 0.03 No relationship
How many frozen meals/pizzas did you consume in past 30 days? -0.02 No relationship

References

[1]Obesity is a common, serious, and costly disease

[2]NHANES - About the National Health and Nutrition Examination Survey

[3]NHANES 2017 - March 2020

[4]Calculating BMI using the English System

[5]How BMI Impacts Sports and How Much You Should Depend on It

[6]Correlation Coefficient: Simple Definition, Formula, Easy Steps

[7]What is Considered to Be a โ€œStrongโ€ Correlation?

[8]Calculate Your Body Mass Index

[9]Diabetes and Asian Americans

[10]Tests for Type 1 Diabetes, Type 2 Diabetes, and Prediabetes

[11]Understanding the Cholesterol Ratio: What It Is and Why Itโ€™s Important

[12]Preserve your muscle mass

[13]Overweight & Obesity

About Author

ziqipolimeros@gmail.com

I currently study at Baruch College and my major is statistics. I'm interested in business, and finance.
View all posts by ziqipolimeros@gmail.com >

Leave a Comment

No comments found.

View Posts by Categories

All Posts 2399 posts
AI 7 posts
AI Agent 2 posts
AI-based hotel recommendation 1 posts
AIForGood 1 posts
Alumni 60 posts
Animated Maps 1 posts
APIs 41 posts
Artificial Intelligence 2 posts
AWS 13 posts
Banking 1 posts
Big Data 50 posts
Branch Analysis 1 posts
Capstone 206 posts
Career Education 7 posts
CLIP 1 posts
Community 72 posts
Congestion Zone 1 posts
Content Recommendation 1 posts
Cosine SImilarity 1 posts
Data Analysis 5 posts
Data Engineering 1 posts
Data Engineering 3 posts
Data Science 7 posts
Data Science News and Sharing 73 posts
Data Visualization 324 posts
Events 5 posts
Featured 37 posts
Function calling 1 posts
FutureTech 1 posts
Generative AI 5 posts
Hadoop 13 posts
Image Classification 1 posts
Innovation 2 posts
Kmeans Cluster 1 posts
LLM 6 posts
Machine Learning 364 posts
Marketing 1 posts
Meetup 144 posts
MLOPs 1 posts
Model Deployment 1 posts
Nagamas69 1 posts
NLP 1 posts
OpenAI 5 posts
OpenNYC Data 1 posts
pySpark 1 posts
Python 16 posts
Python 458 posts
Python data analysis 4 posts
Python Shiny 2 posts
R 404 posts
R Data Analysis 1 posts
R Shiny 560 posts
R Visualization 445 posts
RAG 1 posts
RoBERTa 1 posts
semantic rearch 2 posts
Spark 17 posts
SQL 1 posts
Streamlit 2 posts
Student Works 1687 posts
Tableau 12 posts
TensorFlow 3 posts
Traffic 1 posts
User Preference Modeling 1 posts
Vector database 2 posts
Web Scraping 483 posts
wukong138 1 posts

Our Recent Popular Posts

AI 4 AI: ChatGPT Unifies My Blog Posts
by Vinod Chugani
Dec 18, 2022
Meet Your Machine Learning Mentors: Kyle Gallatin
by Vivian Zhang
Nov 4, 2020
NICU Admissions and CCHD: Predicting Based on Data Analysis
by Paul Lee, Aron Berke, Bee Kim, Bettina Meier and Ira Villar
Jan 7, 2020

View Posts by Tags

#python #trainwithnycdsa 2019 2020 Revenue 3-points agriculture air quality airbnb airline alcohol Alex Baransky algorithm alumni Alumni Interview Alumni Reviews Alumni Spotlight alumni story Alumnus ames dataset ames housing dataset apartment rent API Application artist aws bank loans beautiful soup Best Bootcamp Best Data Science 2019 Best Data Science Bootcamp Best Data Science Bootcamp 2020 Best Ranked Big Data Book Launch Book-Signing bootcamp Bootcamp Alumni Bootcamp Prep boston safety Bundles cake recipe California Cancer Research capstone car price Career Career Day ChatGPT citibike classic cars classpass clustering Coding Course Demo Course Report covid 19 credit credit card crime frequency crops D3.js data data analysis Data Analyst data analytics data for tripadvisor reviews data science Data Science Academy Data Science Bootcamp Data science jobs Data Science Reviews Data Scientist Data Scientist Jobs data visualization database Deep Learning Demo Day Discount disney dplyr drug data e-commerce economy employee employee burnout employer networking environment feature engineering Finance Financial Data Science fitness studio Flask flight delay football gbm Get Hired ggplot2 googleVis H20 Hadoop hallmark holiday movie happiness healthcare frauds higgs boson Hiring hiring partner events Hiring Partners hotels housing housing data housing predictions housing price hy-vee Income industry Industry Experts Injuries Instructor Blog Instructor Interview insurance italki Job Job Placement Jobs Jon Krohn JP Morgan Chase Kaggle Kickstarter las vegas airport lasso regression Lead Data Scienctist Lead Data Scientist leaflet league linear regression Logistic Regression machine learning Maps market matplotlib Medical Research Meet the team meetup methal health miami beach movie music Napoli NBA netflix Networking neural network Neural networks New Courses NHL nlp NYC NYC Data Science nyc data science academy NYC Open Data nyc property NYCDSA NYCDSA Alumni Online Online Bootcamp Online Training Open Data painter pandas Part-time performance phoenix pollutants Portfolio Development precision measurement prediction Prework Programming public safety PwC python Python Data Analysis python machine learning python scrapy python web scraping python webscraping Python Workshop R R Data Analysis R language R Programming R Shiny r studio R Visualization R Workshop R-bloggers random forest Ranking recommendation recommendation system regression Remote remote data science bootcamp Scrapy scrapy visualization seaborn seafood type Selenium sentiment analysis sentiment classification Shiny Shiny Dashboard Spark Special Special Summer Sports statistics streaming Student Interview Student Showcase SVM Switchup Tableau teachers team team performance TensorFlow Testimonial tf-idf Top Data Science Bootcamp Top manufacturing companies Transfers tweets twitter videos visualization wallstreet wallstreetbets web scraping Weekend Course What to expect whiskey whiskeyadvocate wildfire word cloud word2vec XGBoost yelp youtube trending ZORI

NYC Data Science Academy

NYC Data Science Academy teaches data science, trains companies and their employees to better profit from data, excels at big data project consulting, and connects trained Data Scientists to our industry.

NYC Data Science Academy is licensed by New York State Education Department.

Get detailed curriculum information about our
amazing bootcamp!

Please enter a valid email address
Sign up completed. Thank you!

Offerings

  • HOME
  • DATA SCIENCE BOOTCAMP
  • ONLINE DATA SCIENCE BOOTCAMP
  • Professional Development Courses
  • CORPORATE OFFERINGS
  • HIRING PARTNERS
  • About

  • About Us
  • Alumni
  • Blog
  • FAQ
  • Contact Us
  • Refund Policy
  • Join Us
  • SOCIAL MEDIA

    ยฉ 2025 NYC Data Science Academy
    All rights reserved. | Site Map
    Privacy Policy | Terms of Service
    Bootcamp Application