NICU Admissions and CCHD: Predicting Based on Data Analysis
The skills I demoed here can be learned through taking Data Science with Machine Learning bootcamp with NYC Data Science Academy.
The Center for Disease Control and Prevention annually publishes selected characteristics for all birth and pregnancy-related events for independent research and analysis. Our project aimed to understand the non-genetic risk factors for congenital abnormalities and neonatal intensive care unit (NICU) admissions and to ultimately predict these instances.
The ability to explain and predict congenital abnormalities and NICU admissions would be valuable for hospitals aiming to optimize staffing and resource usage, for primary care physicians in identifying patients who might require closer monitoring, and for expectant mothers seeking additional information on key risks during pregnancy.
Data Set
In 2018, 3.8 million live births were recorded in the United States, each with over 200 features including characteristics of the mother, father, baby, the delivery, as well as which babies were admitted to the NICU. Information from previous years contained a comparable number of births and features.
The data comes in a fixed width file format where each feature occupies a specific space within a certain length of characters. An associated user guide in PDF provides information on the file layout and detailed technical notes. The PDFs for more recent years were digitally created so their text was readily accessible, whereas those from the 1990’s and earlier were image only, requiring optical character recognition tools to access the text.
Data Extraction and Transformation
User guides for recent years, 2016-2018, were converted into text. On that basis we were able to generate a key using regular expression to convert the fixed width format. The process captured around 97% of the features; the rest of the keys were extracted manually. Through this, 15GB of data in fixed width format file was split into corresponding features, converted to CSV, and imported into a MySQL database.
Exploratory Data Analysis
Many features were represented more than once in the dataset, often grouped with different levels of granularity. To understand factors contributing to NICU admissions, we chose to look at less granular information. For instance, if the mother’s age affects NICU admission this would be detectable using age brackets and would not require the granularity of every age. Using this approach we reduced our feature set to 91 variables, which were used for exploratory data analysis and initial modeling approaches.
In contrast, when investigating congenital abnormalities, we chose to retain the most granular encoding of variables. The number of positive cases for congenital abnormalities was relatively small despite the large size of the dataset, so we chose to retain as much information as possible.

From our original exploratory analysis and modelling (see below), variables associated with labor and delivery showed a very strong relationship with NICU admissions; however, this wouldn’t be useful in predicting NICU admission at an early stage of pregnancy. Therefore, we shifted our focus to variables that would be available before the labor and delivery to potentially educate primary healthcare providers and the pregnant mothers and to reduce the NICU admission rate.
Broad Variable
Overall, there are three broad variable classes available before labor and delivery: mother’s physical characteristics, mother’s medical history , father's background , and the baby’s condition during pregnancy. The graphs below show relationships between these factors and NICU admissions. Gray sections of the bars indicate ‘No NICU admission’ and the red sections indicate ‘NICU admission.’ Yellow lines represent the 9.14% average NICU admissions rate for all babies born in 2018.
Mother’s Physical Characteristics
Two variables of the mother’s physical characteristics stood out as the most strongly related to NICU admissions: body mass index (BMI) and age. While NICU admissions increased at both extremes, mothers with BMI score over 40.0 and mothers over 40 years of age showed more significant increases. For mother’s older than 45, the risk of babies born with a critical condition increased two-fold.


Mother’s Medical History
Previous pregnancy history, such as having had a pre-term birth and/or a prior termination of pregnancy, voluntary or other-wise, correlated with higher NICU admission rate. Prior pregnancy complication might have genetic or physical reasons that can also affect current or future pregnancies.


There were other medical history factors that correlated with NICU admission. One was smoking cigarettes during pregnancy. Compared to a non-smoker, a mother who were smokers prior to or during pregnancy had a higher risk of babies ending up in the NICU. Also, mothers with certain medical conditions, such as hypertension or diabetes, prior or during the pregnancy (gestational), showed a higher rate of newborns with NICU admission.


Baby’s Condition During Pregnancy
Variables related to the baby’s condition during pregnancy were more strongly correlated to NICU admission than any conditions of the mother alone. Many congenital abnormalities detectable during routine prenatal visits lead to a high rate of NICU admissions. Being pregnant with more than once child (plurality) increases the risk of underweight and premature birth, thus leading to a higher chance of NICU admission. While 40% of all births of twins in 2018 led to NICU admissions, the rate rose to over 80% for triplets, quadruplets, and more multiples.


Data Visualization
From our data visualizations, we identified that a large proportion of babies born with a congenital abnormality called cyanotic congenital heart disease (CCHD) was admitted to NICU. Cyanotic congenital heart disease is a condition present at birth in which complications in heart function lead to low blood oxygen levels evident through a bluish tint of the skin.
CCHD contributed the largest absolute number of babies being admitted to the NICU across all congenital abnormalities captured in the dataset. The CDC notes that critical congenital heart defect–associated hospitalizations represents the highest mean and median cost among birth defect categories considered ($79,011 and $29,886, respectively). Furthermore, while there is a genetic component to CCHD, its etiology remains largely unknown. As a result, we deemed CCHD to have the highest medical urgency and unmet need among all captured abnormalities. For that reason, we focused one branch of our project on CCHD.
Despite its unknown etiology, previous studies have established links between CCHD and toxic chemical exposure, exposure to certain drugs, infections, and diabetes during pregnancy. As these factors or potential proxies (e.g., demographic data) are captured in our dataset, we hypothesized that it may be possible to predict CCHD or at least identify some statistically significant explanatory factors.
For more extensive analysis, please feel free to explore our Tableau dashboard.
Dataflow and Processing
The two targets of predicting NICU admission and CCHD paired with the different models required data to be cleaned and processed in parallel workstreams. A schematic of the workflow is presented below.
 Data Pipeline and Workflow
The target of the predictive models appear only as a small fraction of our dataset. To avoid artificially inflated classification model scores, we chose to optimize precision and reduce false positives rather than focus on overall accuracy. Precision was chosen as the metric because accurately predicting true positives while minimizing false positives was imperative based on our primary use cases. For example, if our model is used to direct specialized resources to closer monitoring of certain patients, it would generate a lot of excess costs if the model’s precision is low.
To test the validity of the models, 10% of the original data was withheld before downsampling as a validation set before further preparation. For most models we used a downsampled dataset to give equal weight to the positive and negative outcomes and this dataset was further processed to meet the requirements of the model being used. For instance, we selected all confirmed cases of CCHD and randomly sampled a matching number of cases without CCHD.
We also removed selected variables to ensure limited multicollinearity (all remaining variables have a variance inflation factor below 5) and thus meet the assumptions of a descriptive logistic model. We performed mode imputation and median imputation for categorical and continuous variables, respectively. For variables with missingness greater than 5%, we retained the information whether or not the value was imputed, as preliminary analysis showed a relationship between missingness and the target variable CCHD. Further details on data processing and imputation can be found here.
Predictive Modeling
NICU admissions
Using RandomForest and XGBoost classifiers, we investigated the most important predictors of NICU admissions with 91 initial variables and a downsampled 2018 dataset. This analysis revealed many highly predictive variables are associated with the delivery, such as the birth weight, the need for assisted ventilation, as well as the 5 min APGAR score, a medical measure of the need for resuscitation at birth and a predictor of the infant's chances of surviving the first year of life.
These aspects of delivery were certainly clear indicators that the baby’s health was in jeopardy at birth and would require NICU admissions. The RandomForest model on the 2018 data set was able to predict NICU admissions at 98% precision or 2% false positive rate. However, our project aimed at identifying early predictors with the hope for possible early intervention or monitoring. We therefore reduced the number of features used for modelling to 56 pre-delivery features. Using only the pre-delivery features lowered the precision of the best models to 67.5%.
Exploratory Data Analysis
Consistent with our exploratory data analysis, a previous preterm birth correlated with higher risk of NICU admissions both in RandomForest and XGBoost models. Moreover, pre-pregnancy hypertension and gestational hypertension developed as a complication during pregnancy, as well as pre-pregnancy diabetes and gestational diabetes increased the risk of NICU admissions in all models.
Most strikingly, investigating the effect of both hypertension and diabetes, we identified a strong medical need to monitor mothers with pre-pregnancy diabetes for development of gestational hypertension. While 26.7% of all newborns from diabetic mothers and 18.9% of newborns from mothers with gestational hypertension needed to be admitted to the NICU, the rate increased to 41.2% when the mother with pre-pregnancy diabetes developed additional gestational hypertension.
 Pre-pregnancy Diabetes and Gestational Hypertension
Based on our understanding of pre-pregnancy risk factors from our modelling approaches and exploratory data analysis, we developed an information leaflet for expectant mothers explaining some of these risks in order to aid the best possible care by primary health physicians during pregnancy.
Congenital Abnormalities
Attempting to build a classification model, we tried various algorithms including logistic regression with forward selection, regularized logistic regression, random forest, and support vector machines. We also tried some outlier detection algorithms including isolation forest and local outlier factor. Hyperparameters were tuned using precision and models were compared using the same metric. Most models we trained performed better than random on the validation set, though precision was quite low even in the best models.
Feature set
We concluded that our feature set was not rich enough to develop a useful predictive model. Moving forward, we’d like to try combining this dataset with genomic or other -omics data to develop a stronger model.
We were, however, able to develop a solid descriptive logistic model using forward selection based on the Bayesian Information Criterion. This model highlighted several statistically significant risk factors detailed in the table below.
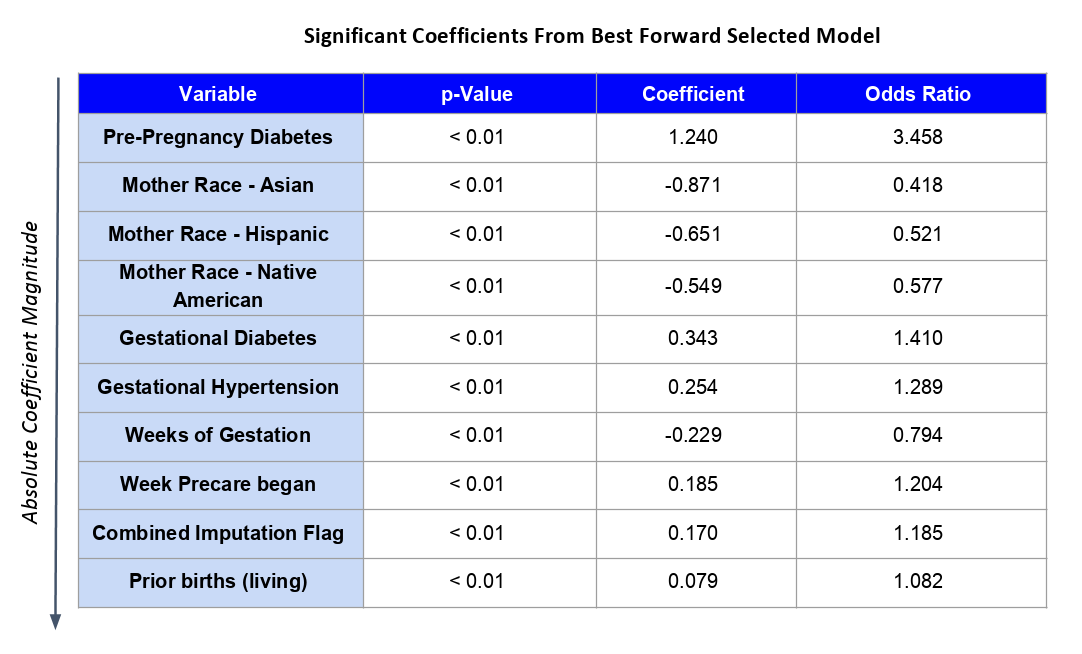
Consistent with previously published literature, diabetes is associated with increased log-odds of CCHD. Being an Asian, Hispanic, or Native American mother has a protective effect relative to being White. Shorter gestation, hypertension, later start to prenatal care, and number of prior births are all associated with increased risk. Interestingly, so is missing information on the intake form, perhaps acting through hidden socio-economic factors and potential correlation with exposure to toxic chemicals.