Becoming a Successful Airbnb Host in NYC
- Introduction
In 2022 New York City ranked among the world’s ‘most powerful’ tourism cities, according to the World Travel & Tourism Council (WTTC). In that year alone, NYC attracted around 56 million tourists, a figure that was expected to increase to 61 million in 2023. From the initial establishment of the Airbnb platform in 2008, to its rebrand in 2014, up until today, it has become a household name for vacation and short term rentals. And now, there are more Airbnb listings in NYC than there are rental listings in NYC, so it is not surprising that people may consider investing in Airbnb properties.
2. Research Questions
The purpose of this project is to identify what indicators Airbnb property investors should consider to maximize potential profits.
The exploratory data analysis seeks to answer the following questions:
- How does someone become a successful Airbnb host in NYC?
- What makes a listing popular?
- For someone aspiring to be an Airbnb host, which areas in NYC would be the most profitable?
- What are the trends saying about the behavior of NYC visitors?
- How can data be leveraged to improve the online booking experience?
3. The Data
The dataset I chose for this analysis was the Airbnb Open Data NYC Dataset found on Kaggle. As this was an already cleaned version, not much additional cleaning was necessary for this dataset. Smaller, additional cleaning was performed, including, rounding down integer values to two decimal places, correcting misspelled column names, and changing certain column values to boolean type values, such as “Yes” or “No.” This dataset showed listing activity of Airbnb listings in NYC with construction years ranging from 2003 – 2022.
4. Exploratory Data Analysis
To start off, a heat map was plotted to show a visualization of which room types were most prominent in each borough. Brooklyn and Manhattan accounted for a majority of both overall Airbnb listings and all entire home/apartment type listings.
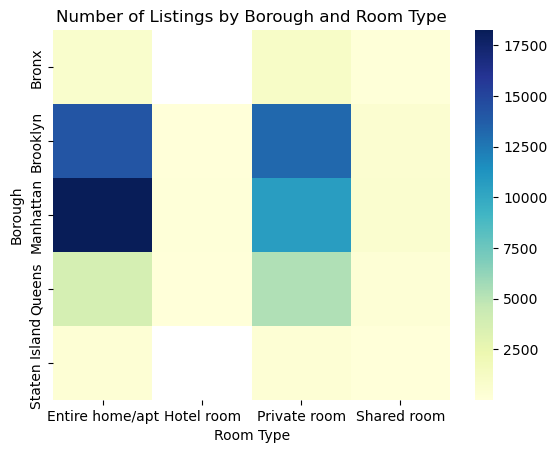
This is most likely due to higher demand. Manhattan is the center of NYC tourism, with Brooklyn coming in second. Identifying where each type of room is most aggregated can be useful for future listers who want to determine where there are opportunities for growth and which areas may be too saturated to be competitive with other listers.
Most in Demand Room Types Per Borough
Using the listings with the highest amount of reviews as the measuring metric, we determined which rooms were most popular. On the Airbnb platform, only travelers who have completed a stay are able to leave reviews. As a review on AirBnB correlates directly to a booking, the review count can work as a measure of popularity.
To get a picture of where the current demand was, the data was filtered by the ‘last_reviewed’ column values, with only the ones that were last reviewed in 2022. This separate data frame was then used to create a bar chart to show which borough and room type combinations were accumulating the highest number of reviews. The results showed that entire home apartments/homes in Brooklyn received significantly more reviews in 2022 than other room/borough combinations. Results may be slightly skewed toward Brooklyn and Manhattan entire apartments/home listings due to their representing the majority of overall Airbnb listings in New York City. The Brooklyn neighborhood has more open space and less hectic environment in comparison to busy streets of Manhattan. It’s possible that travelers are preferring to stay in more private and less busy areas.

Highly Saturated Neighborhoods in NYC
The data reveals the top 10 neighborhoods with the largest number of listings. The results of this bar graph are able to show potential future listers what areas they might want to avoid investing in. The more saturated the neighborhood is already with listings, the harder it will be to remain competitive and receive a greater ROI on the property.

Analyzing the Distribution of High-Rated Rooms
The data was then grouped by only the listings that received either a 4.0 or 5.0, measured as good and great respectively. The distribution of ratings per room type was also dependent on the total number for each room type. The greater the number of available listings for a particular room type, the higher the likelihood of receiving higher ratings, and conversely, the lower the likelihood of receiving lower ratings. Of a total of 69,305 listings, there were 37,212 entire home/apartment listings and 30,508 private rooms. Together, they made up around 97% of all listings, which explains why these two room types make up a majority of the high rated listings.

Almost the same patterns in distribution were seen when highly rated rooms were grouped with each borough and room type as well. The data was consistent with where and which type of listings were most saturated: Manhattan, Brooklyn and entire home/apartments and private rooms.


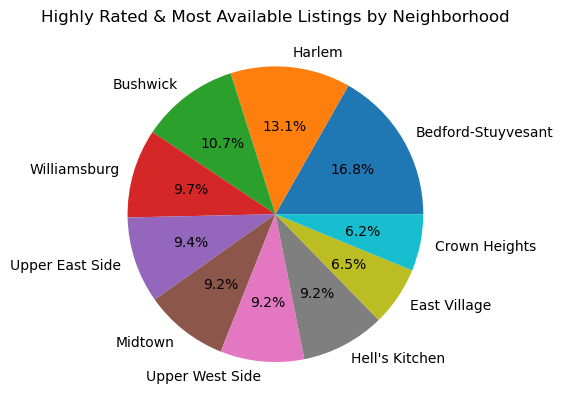
Year-Round Available Listings (365 days)
After grouping the data by high-rated listings that were available 365 days, a pie chart was used to visualize the top 10 results. This was almost 100% consistent with the top 10 neighborhoods with the most number of listings.
Identifying Common Description Words&Phrases in the Top 100 Most Reviewed (Review Count)
In order to determine if there were specific keywords and phrases that were commonly associated with the most booked listings, a word count was done on the top 100 most reviewed listings. Any words that appeared more than two times among the 100 most reviewed listings were pulled and organized into a word cloud. In addition, any filler words or symbols, such as &, of, -, +, !, the, etc. were excluded in the word count.
We found that location specific keywords were significant. Words regarding proximity to nearby airports and the subway were observed and also the words, “Private” and “Quiet”, suggested that travelers prefer to stay in quieter areas with more privacy. “No cleaning fee” was seemingly also important but not preferred by travelers. And consistent with the demand, Brooklyn and Manhattan were also among the most frequently appearing words in the top 100 most popular listings.

This analysis will help Airbnb owners pick the right words and phrases when describing their listings to help improve their visibility in search results. Greater visibility should increase the number of bookings for their properties
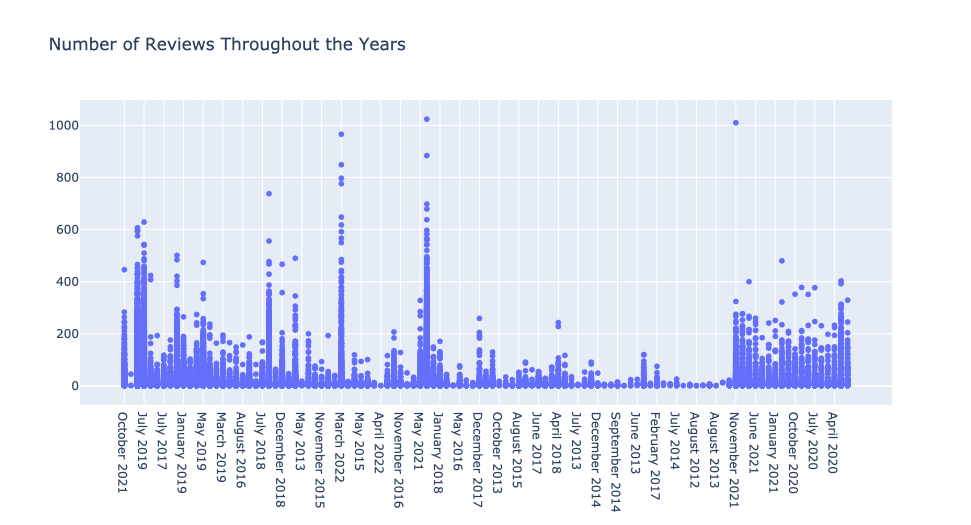
A Look at Seasonality Over Time
In order to measure seasonality most accurately, this dataset would have needed to have the actual booking dates recorded. In order to get a picture of the seasonality demand over time as closely as possible, a scatterplot was set up to visualize the number of reviews (y axis) against the last date it was reviewed ( x axis). The last reviewed date column values were reformatted into just the month and year values for ease of visualization.
January, February and March 2022 saw the highest spike in number of reviews, with June and July 2019 following closely behind. January to March is usually considered off-season for travel, so these months would be the cheapest time to travel. In addition, 2022 saw international travel surpass pre-pandemic levels. People were most likely more comfortable traveling in 2022 compared to 2020 and 2021, which were the peak times of the pandemic.
Airbnb Stay Attributes
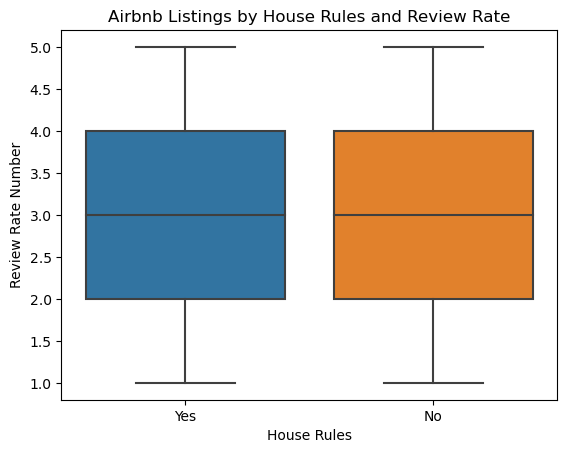
Another important thing to know is if any attributes associated with the listing had an effect on the booking rate, price, and ratings. Listings with a one night minimum stay saw the most amount of bookings and reviews. A box plot was used to see if the cancellation policy (ranging from flexible, moderate to strict) and instant bookability had an effect on price, and it was found that they did not.


House rules also had no effect on a listing’s rating.
Determining the Most Optimal Price for Each Area and Room Type
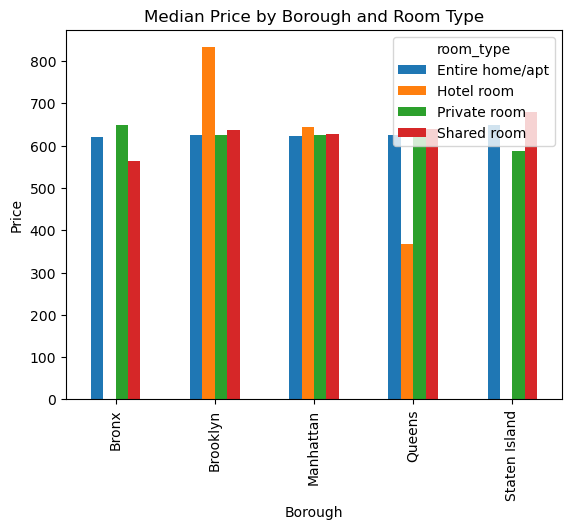
As a potential investor in a property to list on Airbnb, it’s important to determine where the price distribution lies to get a sense of how a listing should be priced. When determining the most optimal price for a listing, it was important to first determine the median pricing for each borough and room type. Compared to the mean, the median is better at determining central tendency for skewed distributions since it is much more robust and sensible.
Based on the results, optimal pricing for someone looking to invest in a property to list on Airbnb would have to consider a price range between $621 - $650 for entire apartments and private rooms if they want to be competitive in the market.


Current Demand of Still Active Listings
Lastly, it was important to see where the current and most recent demand lied, so focus was put on specific NYC neighborhoods by filtering out the top 10 areas that had the most amount of bookings/reviews in 2022 alone. This was also used as a metric to see which listings were still active, as well. Of the listings that are still active, the Bedford Stuyvesant neighborhood in Brooklyn had substantially more bookings in 2022 compared to other neighborhoods. This also aligns with the previous analysis results of Brooklyn entire apartments being the most in demand.
5. Conclusion
Based on this exploratory analysis of the given dataset, location is a clear factor that travelers take into consideration when booking a room on Airbnb.
Proximity and closeness to specific areas, such as subways, airports, popular areas like Manhattan and Brooklyn, were also important decision factors. Analyzing the most common keywords associated with popular listings will become meaningful data that can be used to establish an algorithm within Airbnb to put more weight on certain keywords based on city and specific neighborhoods. When deciding how to describe a listing to reach the target traveler faster, these factors and keywords should be taken into account.
It is clear that entire apartments and private rooms in Brooklyn and Manhattan are the most popular boroughs and room types respectively. However, highly saturated areas like Brooklyn and Manhattan are most likely too saturated with listings already, making it that much more difficult to stay competitive against other listings. That means an investor should carefully consider which section of these popular boroughs to invest in.
6. Future Works
There were quite a few more areas that required further exploration in order to obtain more accurate business insights. Data on which listings were Superhosts or regular hosts would have been very helpful in determining their impact on booking rate. In addition, data on exact booking dates, length of stays, and which days of the week the bookings occurred could give us insight into which specific days and periods of the year are seeing the most travel activity.
Finally, information on each listing’s reviews could also be used to perform a common word/phrase count as we did with the listing descriptions as well. This will help identify whether a listing’s reviews are mostly positive or negative, so that we may differentiate between reviews and quality of the listings. A review on Airbnb may mean a booking, but it does not necessarily mean it’s a positive review.