Clustering Analysis for Single Family Residences in GA

In collaboration with haystacks.ai, an AI/ML-driven company specializing in predictive market intelligence for real estate investors, this research aimed to address a challenge posed by haystacks.ai. The primary objective was to explore the potential of alternative data in identifying and characterizing anomalies within the statewide single-family residential (SFR) housing market.
The Significance of Alternative Data: Alternative data offers a promising avenue in the realm of proptech as it can supplement traditional analyses by incorporating factors that are often overlooked. This type of data is frequently accessible at little to no cost and encompasses various sources such as public crime and risk data, points of interest, schools, and more. For this research, alternative data sources were derived from scraped listings and information pertaining to the housing market in Georgia.
Challenges in Anomaly Detection with Alternative Data: While alternative data holds immense potential, it also poses certain challenges when it comes to anomaly detection. The nature of alternative data is often characterized by noise and coarseness. Consequently, conventional anomaly detection methods may inadvertently identify regions that possess certain rare properties compared to the rest of the state, while potentially overlooking many other true anomalies.
By acknowledging these challenges and leveraging the advantages of alternative data, this research endeavors to shed light on its effectiveness in identifying and characterizing anomalies within the statewide SFR housing market.
Introduction:
(SFR) in Georgia State. Through the utilization of state-of-the-art machine learning models from Python's scikit-learn library, we strive to provide valuable insights into outlier identification, anomaly characterization, and investment opportunities in various neighborhoods. By combining the expertise of data science and real estate analysis, this aims to revolutionize the way we understand and navigate the SFR market.
This project applies clustering techniques to analyze the housing market for single-family residences
Project Objectives:
- Outlier Identification and Anomaly Characterization:
- Our project utilizes clustering algorithms to identify outliers in the housing market and classify different types of anomalies. This enables us to pinpoint properties or areas that deviate significantly from the norm, providing valuable insights for investors and professionals in the real estate industry.
- We aim to offer data-backed insights to SFR PropTech investors who seek long-term growth potential in specific neighborhoods. By analyzing outliers and anomalies, we can help investors make informed decisions and identify areas with high growth potential.
- Diverse Metrics for Identifying Opportunities:
- In addition to outlier identification, our project aims to provide diverse metrics and indicators for identifying underappreciated investment opportunities. By leveraging clustering techniques, we can uncover hidden patterns and similarities among properties, enabling real estate professionals to enhance their decision-making processes.
- By incorporating various data sources and utilizing advanced machine learning models, we strive to equip professionals with comprehensive insights that go beyond traditional methods of evaluating investment opportunities.
Project Motivation: Traditional methods of demarcating local areas, such as zip codes, often fail to capture the nuanced dynamics of the housing market. This limitation led us to explore alternative approaches, such as machine learning clustering techniques. By leveraging the power of data science, we can determine natural clusters for Single Family Residences, enabling a more accurate understanding of neighborhood dynamics and investment potential.
Data Description: Our project utilizes data provided by HaystackAI, which includes proprietary information protected under copyright laws. To enhance the dataset, we performed data engineering and incorporated publicly available alternative data sources, including Broker Listing Data, Crime Diary, Census information, Local News, Amenities, and Financial data. The dataset comprises both categorical and continuous variables, allowing us to capture a holistic view of the SFR market.
Data cleaning and Exploratory Data Analysis (EDA): The first step in any data analysis project is to clean and preprocess the data. In this project, we performed data cleaning to handle missing values, remove outliers, and ensure consistency in the dataset. EDA techniques were applied to gain a better understanding of the data distribution, identify patterns, and detect any anomalies. The original data has 31064 rows and 21 columns. We merged the original dataset with 9 other alternative datasets on population, income distribution, population growth, sfr growth, per capita income, crime_rating etc. We imputed missing data, dropped outliers, and subsetted the data to the case of detached apartments only.
Feature Engineering
We performed feature engineering to enhance our understanding of the housing market. We introduced several new features that provided valuable insights into different aspects of the data. For instance, we calculated features such as "4yrs_min_pop_growth," "4yrs_max_pop_growth," and "avg_growth" to capture population growth trends over a specific time period. These features helped us analyze the dynamics of population changes and understand the potential growth opportunities in different neighborhoods. Additionally, we engineered features like "groc_km" and "rest_6km" to quantify the availability of grocery stores and restaurants within a certain radius of each residence. These features provided valuable information about the amenities and convenience in different areas. Furthermore, we incorporated the feature "Crime_Rating" to assess the safety and security of neighborhoods based on reported crime incidents. Overall, feature engineering played a vital role in enriching the dataset and enabling us to answer crucial questions related to population growth, amenities, and crime rates in the context of single-family residences in Georgia State.
From the alternative Dataset, one can see the region that has the highest population in 2022.

The richest and the poorest neighbourhoods.

The availability of grocery stores or restaurants within 6km radius

The Crime Rating per location.

Dimensionality Reduction - Principal Component Analysis (PCA): To handle high-dimensional data and reduce the number of features, we employed dimensionality reduction techniques. Specifically, Principal Component Analysis (PCA) was used to transform the original features into a smaller set of uncorrelated variables called principal components. This technique helped us capture the most significant variations in the data while minimizing information loss. Via the PCA, We reduced the 40 columns of the dataset to 7 columns. Each column is the first principal component of PCA of closely related features.
Principal Component Analysis

Clustering algorithms -We employed various clustering algorithms to identify meaningful patterns and groupings within the dataset. We tested several popular techniques, including K-means with different initializations, Mini-Batch K-means, Agglomerative Hierarchical Clustering, and DBSCAN. To determine the optimal number of clusters, we utilized evaluation metrics such as the Elbow Method and Silhouette scores. After careful evaluation, we found that the dataset was best represented by seven distinct clusters. To derive these clusters, we specifically used the K-means algorithm with the initialization method set to k-means++. Interestingly, despite employing different clustering techniques, we observed that the resulting clusters showed striking similarities. This consistency across different algorithms reinforces the robustness of the clustering results and provides confidence in the groupings we have identified within the housing market data.


Generating labels: After performing clustering, we assigned labels or cluster memberships to each data point. These labels provided insights into which cluster each single-family residence belonged to. Labeling the data points facilitated further analysis and interpretation of the clusters.

The clusters in this study provide various options for single-family investors based on their specific needs and preferences. For instance, investors seeking long-term growth opportunities may find Cluster_0, Cluster_1, and Cluster_3 particularly appealing. However, it is important to note that Cluster_0's high crime rate may discourage some investors, while Cluster_3's higher price point offsets its otherwise desirable characteristics.
On the other hand, private investors may find Cluster_6 attractive due to its very low crime rate. Although this cluster may have limited amenities and higher costs, it presents a favorable option for those prioritizing safety and security in their investment decisions.

Subcluster analysis and recommendations: In addition to the main clusters, we conducted subcluster analysis to explore more granular patterns within each cluster. This analysis helped us uncover distinct subgroups or subclusters within the larger clusters. By examining the characteristics and trends within these subclusters, we were able to provide more specific recommendations tailored to different types of single-family residences in Georgia State.

The counties with very high prices are represented with orange while the low prices are represented in blue.

Overall, Cluster_3 seems to be the best investment option when cost is not considered. On the other hand a low budget investor may consider Cluster 1 with the hope that amenities will eventually improve and Crime_Rating reduce
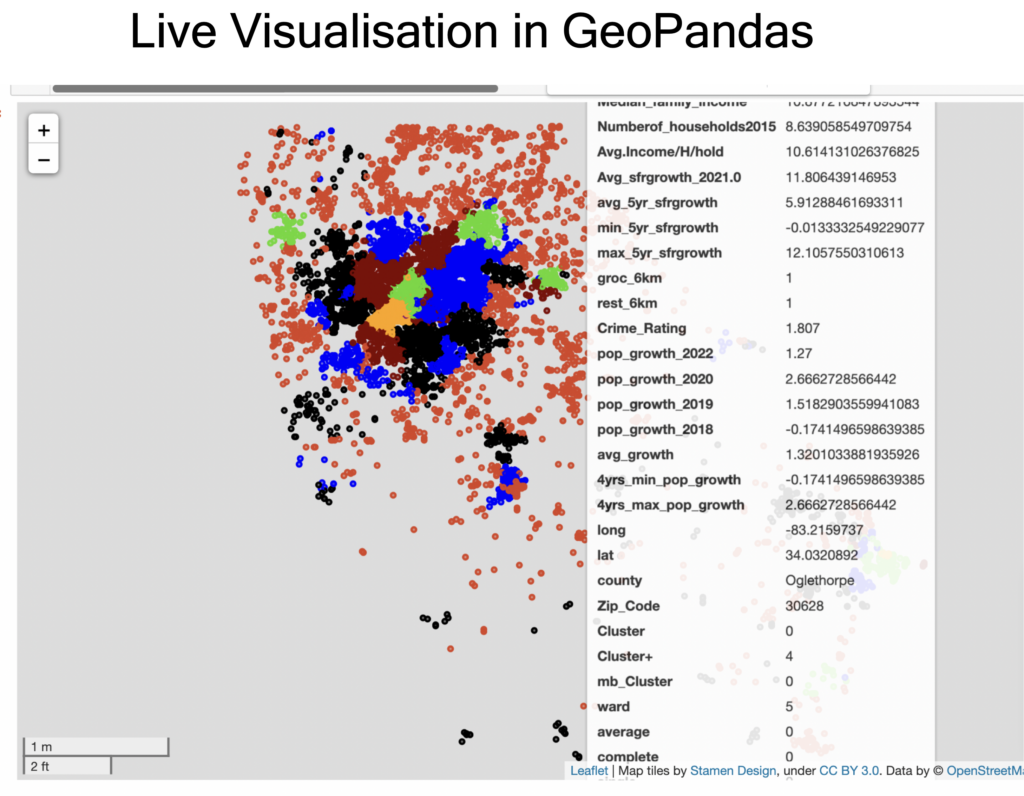
Visualization: Visualizing the clustering results in real time is crucial to gaining insights and communicating the findings effectively. We employed various visualization techniques, including scatter plots, heatmaps, and geographical maps, to represent the clusters and their properties visually. Visualizations provided a clear and intuitive way to understand the distribution of single-family residences across different clusters and their relationships with various factors such as location, amenities, crime rates, and more.

Conclusion: By applying clustering analysis techniques to the housing market for Single Family Residences in Georgia State, the collaboration between NYC Data Science Academy and HaystackAI aims to provide invaluable insights for investors and real estate professionals. The project's objectives encompass outlier identification, anomaly characterization, identification of gentrification trends, and identification of investment opportunities. By leveraging machine learning models and diverse data sources, we strive to facilitate informed decision-making and enable professionals to stay ahead of the market in the real estate sector.
While this project represents a significant step forward, there are further avenues for exploration. For instance, analyzing the Capitalization Rates (Cap rates) by incorporating rent prices would provide additional insights for investors.

