Data Driven Forecasts About Ames, IA House Prices and Critical Features
GitHub
The skills the author demonstrated here can be learned through taking Data Science with Machine Learning bootcamp with NYC Data Science Academy.
Introduction
The Ames Housing dataset was compiled by Dean De Cock for use in data science education and consists of about 2500 house sale records during 2006−2010 (Ames is the college town of Iowa State University). It is used by data scientists as a modernized and expanded version of the often cited Boston Housing dataset. The Ames dataset is also hosted on Kaggle to be used for an entry-level competition.
Objective
The objective of the project is to use this dataset to
- perform descriptive data analysis to gain business insights
- build machine learning models to describe the local housing market and to use these models to predict house prices in that market
Business Opportunities
Our team identified several business opportunities. They included:
- Provide the best prediction of house value to
- Homeowners looking to sell their property – As is well known, if a property is priced too high, it can sit on the market for a long time , and then the homeowner may have to drop the price even lower than what they could have obtained had it been priced right in the first place.
- Homebuyers – Newcomers to a town usually have a budget in mind and look for features such as a good school district, low crime, physical attributes of the house (bedrooms, bathrooms, garage, basement, sq ft area, etc.) and their goal is to find the best combination of these within their budget. Providing a prediction of the value of different house attributes such as neighborhoods, size, etc. would be quite helpful.
- To provide the best analysis to investors (“flippers”) who buy properties, upgrade and sell them – a predictive model that helps identify undervalued properties, given current market prices, and identifies the most value additive upgrades, based on the current costs of performing those upgrades.
- Provide the best analysis to homeowners on how much a particular remodeling project could increase house value – while homeowners remodel their property for the benefits of living in an upgraded home, they often consider the potential increase in house value from the remodeling in deciding how much to invest in the remodeling project. A model that predicts the increase in house value due to different types of upgrades would be helpful to the homeowner as it is to the flipper mentioned above.
Modeling Approach
The modeling approach used here is to treat a house as a bundle of attributes (e.g. neighborhood, sq footage, number of bedrooms) and to treat the price as reflecting the value of this bundle. Then, the relationship between the prices observed on sold houses and their attributes is modeled and this model is then used both to describe how different attributes affect the sale price of a house and to predict the sale price of a house given its attributes.
Data
The dataset contains detailed information about the house attributes, along with sale prices. It
- covers the period from Jan 1, 2006 – July 31, 2010
- is a csv file with 2580 rows x 81 columns
Documentation about the dataset can be found at http://jse.amstat.org/v19n3/decock/DataDocumentation.txt .
Of the 81 columns, SalePrice is the target, PID is the identifier and the remaining 79 columns are the features used in the modeling. Given the large number of features, it made sense to group them by the type of attributes captured by them. Accordingly, the features were grouped as follows (details in appendix):
- Year of sale - 1 column
- Month of sale - 1 column
- Neighborhood characteristics - 4 columns
- External/lot characteristics - 9 columns
- Building characteristics - 62 columns
- Number of rooms (7 columns)
- Area (15 columns)
- Above ground (4), Basement (4), Garage (2), External (5)
- Quality (28 columns)
- Overall building (7), Building (4), Basement (6), Garage (5), Roof and Exterior (6)
- Miscellaneous (12 columns)
- Utilities (5), Other (7)
- Sale Type/Cond - 2 columns
Preprocessing and Exploratory Data Analysis
To begin with, we inspected the dataset for missing values. In this process, we identified 4 features that had greater then 2000 observations missing out of a total of 2580 observations. These are ‘PoolQC’ (Pool quality) with 99.6% missingness, ‘MiscFeature’ (Miscellaneous feature not covered in other categories) with 96.3% missingness, ‘Alley’ (type of alley access to property) misses 93.4% observations, and ‘Fence’ (fence quality) has 80% missing values. We excluded columns ‘PoolQC’ and ‘MiscFeature’ from further analysis.
A closer look at ‘Fence’ and ‘Alley’ features, however, along with cross-referencing the data dictionary suggested that null values in these 2 have a special meaning. ‘NA’ here means ‘No alley access’ in the ‘Alley’ feature and ‘No Fence’ in the ‘Fence’ feature. Therefore, ‘NA’ values were accordingly replaced. We also found ‘NA’ values in other categorical features to hold a special meaning. They were thus adequately replaced with a new class per data dictionary’s definition.
Further, we found only 1 continuous feature i.e. ‘Lot Frontage’ (linear feet of street connected to property) to contain 462 missing values. We imputed these using the mean Lot Frontage of houses in the neighborhood in which the missing value house fell into. Once missingness was taken care of, we split the features up into various groups i.e. building characteristics, external/lot characteristics, sale type, neighborhood, time of sale (year and month sold). The building characteristics were further sub-classified as illustrated below in Table 1.

Table 1. Sub-classification of Building Characteristics
As part of EDA, we then studied how individual features correlated with response variable using several visualization tools such as scatter plots and histograms for continuous variables and box plots for categorical features (Figure 1).

Figure 1. Univariate Feature Analysis

Modeling
Based on univariate data analysis and visualizations, we chose 40 features to fit linear and random forest models. First, we dummified all the qualitative features, which stretched the dimensionality of our feature space from 40 to 138 and also resulted in heightened multicollinearity.
In order to obviate the encountered issues, we took a step back and started again by fitting a linear model with all 78 features. Using Variance Inflation Factor (VIF), we tested for multicollinearity and dropped 3 features that had VIF >5.
Then, we looked to see if continuous variables in our dataset satisfied the assumption of normality. Most of them, including the response variable i.e. Sale Price, were not found to be normally distributed. Therefore, we performed “logarithmic” and “square root” transformations of these as deemed necessary. Next, we performed a stepwise “both” feature selection procedure using BIC as the criterion. Here, we started either with just an intercept term or a model that included all transformed continuous variables, as well as qualitative features, and then sequentially added or removed the predictor variables, depending on which ones had the greatest/smallest impact on the model. Through this process, we shortlisted a set of 27 features, which we moved forward with for linear models.
Multiple Linear Regression
In order to evaluate both Multiple Linear Regression (MLR) and Random Forest models on the same test set, we first split up the dataset into 80:20 train and test sets. For MLR, we developed three models, the first consisting solely of the 9 continuous features. These primarily included the variables related to area along with Year built and Year Remodeled. Just these 9 continuous features were able to explain 82% of the variance in the response variable. For the second model, we added the qualitative features as well. Some of these variables were evidently ordinal, so we used the ordinal encoding from scikit learn. The remaining variables were nominal and were dummified.
We finally ended up with a dataset of 75 features. Regression on this set resulted in a training R2 score of 92.93%. Further, to create a more robust model we used Lasso to shrink the coefficients. To this end, after some experimentation, we settled on a range of 100 lambda values. For each of these lambdas, we conducted a 5-fold cross-validation to find an optimal lambda. In this process, lasso pruned 25 features, pulling their coefficients to 0. As can be seen in Figure 2, there are empty spaces in between the bars. These empty spaces correspond to features whose coefficients were turned down to 0.

Figure 2. Barplot showing the Lasso determined attributes' coefficients
Thus, we dropped the 25 variables suggested by Lasso and ran another regression. Upon testing our final model for assumptions of linearity, homoscedasticity, and normality, we found them satisfied as shown below in Figure 3.
Although we noticed 5 outliers, for which our model was conservatively predicting, a closer look at these properties didn’t reveal anything markedly differently compared to others. We opine that the buyers of these properties overpaid.

Linear Relationship of Actual and Predicted

Homoscedasticity of Residuals

Normally distributed Residuals
Overall, our final MLR model is predicting with an average error of ~$23000. Figure 4 compares the train and test scores and Root Mean Squared Error (RMSE) for three models.

Figure 4. MLR models scores comparison
Additionally, we had compared the p-values and coefficient of features in all models and had found Lasso to be in accord with p-value information relayed by Model 2 that was run prior to Lasso. Table 2 shows a snapshot of the comparison. Features that were found insignificant in model 2, as suggested by high p-values, had their coefficients turned to 0 in Lasso.

Table 2. Lasso Coefficients consistent with Model-2 p-values
Next, we quantified the effect of each of these variables. Table 3A compares the property sale price in different neighborhoods with respect to North Ames. Neighborhoods highlighted in green represent those where a person would buy at a premium, while orange highlights present neighborhoods that would sell at a discounted price compared to North Ames.
For example, if a person is looking at 2 identical houses to purchase, one in North Ames and one in GreenHills, he can expect to pay about a 60% premium for the house in GreenHills (top row in Table 3A). Similarly, an identical house in Edwards neighborhood (bottom row) would sell at a 3.4% discount.
In terms of zoning, the houses located in commercial neighborhoods sell at a 17.3% discount compared to those located in residential low density.

Table 3A

Table 3B
Table 3B compares how different zoning classification can affect the sale price. Here, residential low density (RLD) was taken as a baseline. As can be seen, houses located in commercial neighborhoods were found to sell at 17.3% discount compared to RLD.
Furthermore, we looked at features of the house that added the most value. Here, we compared a house with standard features to a house with targeted features (Table 4A). Features highlighted in green represent the sale price premium one could expect if a house would be upgraded to the target state.
For example, we found that if the overall condition and quality of a house is improved from average to excellent, the price goes up more than 50%. Likewise, if the kitchen quality is improved from average to excellent, the price can be increased by 6.4%. The orange highlights indicate houses that would sell at a discounted price. Most houses in this dataset have central air, and a house that doesn’t have that feature would be expected to have a lower price.
How this could work to optimize the sales prices: Assume that someone was looking to sell their house and came to us for an evaluation. Upon investigation, we found that their heating quality was average compared to what was standard. We would recommend that they upgrade it to excellent quality to fetch more than 5.5% premium. Also, they should ensure that the cost for upgrade doesn’t offset the gain.

Table 4A
Table 4B shows the contribution of area related features to the sale price. With each additional square foot, price goes up. For instance, if one had 150 additional square feet over 1070 on the first floor, they can expect a higher sale price of approximately $10000. Table 4C shows the impact the condition of the house has on the sale price. For example, if we put our money down on a house that’s still under construction, which is indicated by partial sale here, we would pay a premium of 3.9% compared to a house that was already built. Similarly, a distressed property would sell at about 10% discount.


Random Forest
We trained Random Forest as our choice for non-linear model using the 40 features we narrowed down from our EDA, prior univariate and regression analysis. Then, we split the data into train and test based on the indices obtained from the split in multiple linear regression. We used the same indices so we could compare both types of models on the same set of data, starting with the process of tuning the hyperparameters using Grid-search. The parameters tuned in this process were max depth, max features, number of estimators and minimum sample split.
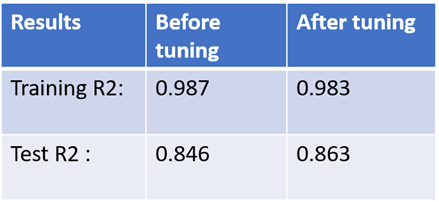
As a result of tuning the hyperparameters using grid search, we were able to lower the high training score and improve the test score. Below are the final scores from pre-tuning and post-tuning of hyperparameters with the list of the best hyperparameters chosen by the model.

Next, we extracted the most important features from Random Forest:
Top 10 Explanative Features of house price:
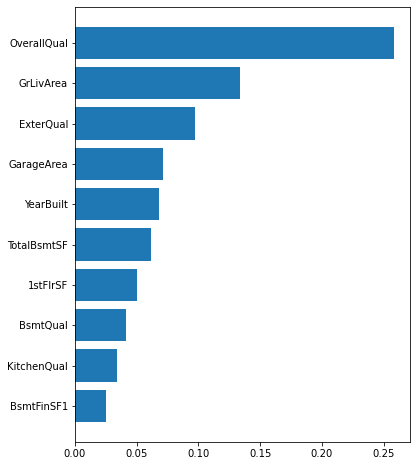

Overall quality represents the overall material and finish of the house. This alone explains about 26% of the house prices. Above ground living area includes the first floor and the second floor. It is ranked second with 13.4% contribution. To our surprise, the garage area was found to be the top fourth most important feature. This could mean that bigger houses are most likely to be accompanied by a good sized garage. The following scatterplot illustrates that garage area has a positive relationship with the house sale price.

The ranking of the important features indicates that area and quality of the house are the most important factors in explaining the house prices. To clarify further, the price of a house is a function of the areas of individual parts of the house and not just the overall area. One important finding is that different areas of the house each contribute differently to the house price based on their level of importance as shown by the model.
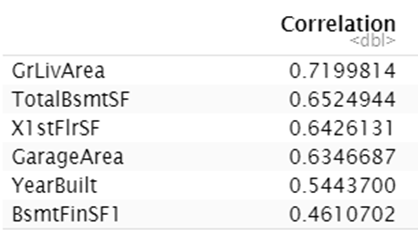
These Important features also corresponded to our findings from the EDA. Interestingly, the order of the Top Important features was consistent with the pearson correlation ranking of features to the house SalePrice:

In addition, as seen below, quality of the basement(height), kitchen and exterior also have a positive impact on the house prices.
Basement Quality(height) and house prices

Kitchen Quality and house prices

Exterior Quality and house prices

With these results in mind, we bring our model to a business case scenario.
For our business objective of providing house value prediction to a prospective homebuyer so they can target houses knowing what prices to pay for the attributes they are seeking, we chose the following scenario:
A professor who joined the Iowa State University faculty is looking for a house for his family and children in a good-school district near the campus where he would be working. We simulated his preferences and estimated a house price in North Ames neighborhood near the campus close to the 4th highest ranked school district in the state. We chose a house that is a 2-story remodeled house having above average overall material quality, 3 bedrooms, 80-89 inches basement ceiling, and an unfinished garage.
Within this scenario, we can advise the professor to expect a house price of $161,711 according to our Random Forest model with a 16% RMSE meaning the forecast is within 16% of the actual value 67% of the time.
To put it in perspective, our model is quite comparable to a real market evaluation like that of Zillow as seen in the figure below:

As we looked at relatively similar smaller midwestern cities like Cleveland and Cincinnati, Ohio, we found for Cleveland for instance Zillow’s house price estimate falls within 20% of the actual sales price about 78.8% of the time according to their website.
Although, we have used Random Forest model for our case study, our MLR model with a higher R2 and lower RMSE is our best model and can predict house prices with 92% accuracy within 13% of the actual value 67% of the time. The following table shows a comparison of both types of models’ performance on predicting house price on the Ames housing data set:

Conclusion
Finally, we found from our analysis that though square footage area overall is probably the most important factor in predicting house price, the distribution of the total area across the different parts of the house - first floor, 2nd floor, bedroom etc - matters significantly and contributes differently in impacting the house price.
In addition, we saw how the overall material and finish of the house, the quality of certain rooms like the kitchen and features like the basement exposure and height are quite significant in the valuation of the house price.
Lastly, we quantified the effect of each individual feature on the house price using our Multiple Linear Regression. This enabled us to compare a house with standard features to a house with targeted features resulting in price differentiation so house owners and buyers can have better expectation and approximation when it comes to renovation and purchase.