Alibaba eCommerce Analysis

Team Alibaba
Lan Mond | Yuqin Xu | Maomao Yi | Xiaofeng Zeng (Fred)
Project & Dataset background:
Alibaba Group Holding Limited is a Chinese multinational conglomerate holding company specializing in e-commerce, retail, Internet, and technology. Tmall.com is one of Alibaba's online trading platform which provides a B2C trading platform for officially registered business and their customers.
Huitong (shorten as HT) is one of the 267,631 registered stores on tmall.com. Started from 2010 , HT sells backpack, toys etc. and had its peak performance through the year but recently, the business is not doing well.
This project aimed to conduct analysis into HT's historical sales records and locate the problems and possible solutions to improve its performance.
Dataset
- 2010 ~ 2019
- about 143,000 order records
- 30 collected features (60 features started from 2019)
- selling products: backpacks and cases for school, electrical puzzles, Toys(including creative thinking enhancement)
- end users: kindergarten ~ 12th G
- buying customers: retail customer (parents ) and whole-sale stores.
Data Cleaning:
- Missing data imputation:
- CellPhone = AlipayAccount
- Null ==> No (For note and messages)
- Delete rows:
- Duplicates
- Exceptions (Shipping only orders)
- Delete columns:
- ContactPhone
- StoreID
- StoreName
- DeliverNo
- New columns:
- Address ==> Province & City
- OrderToPay(s)
- PayToReceive(h)
(includes but not limited to the above)
Sales Performance
Historical Sales Trend
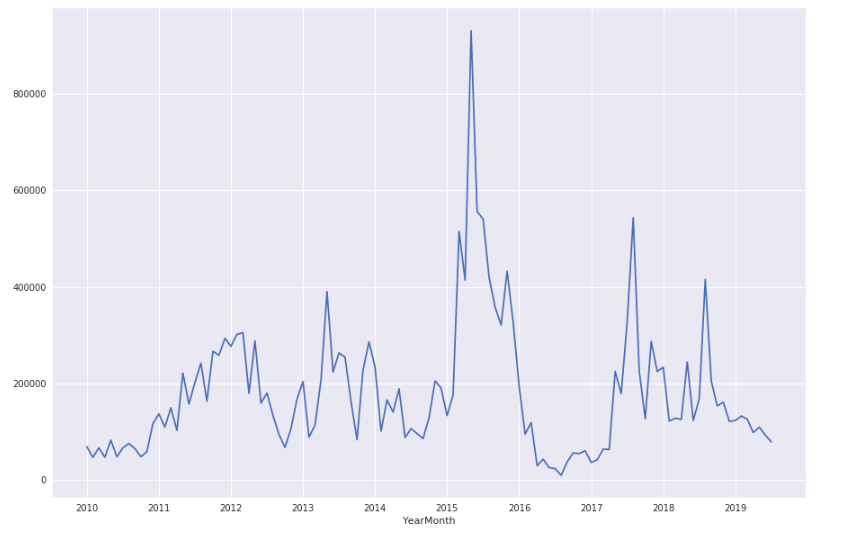
Accumulated sales: ¥20,704,459
Best month: May-2015 sales: ¥930,000
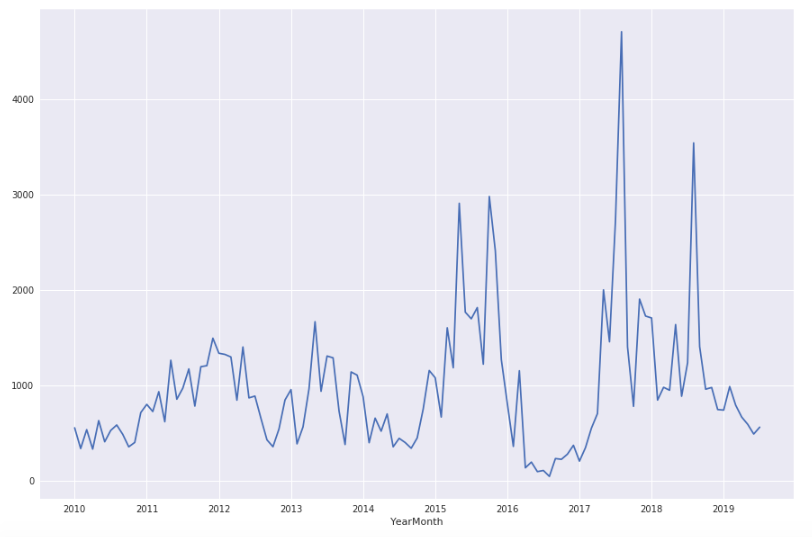
Order Count Trend
Sales -- By Region
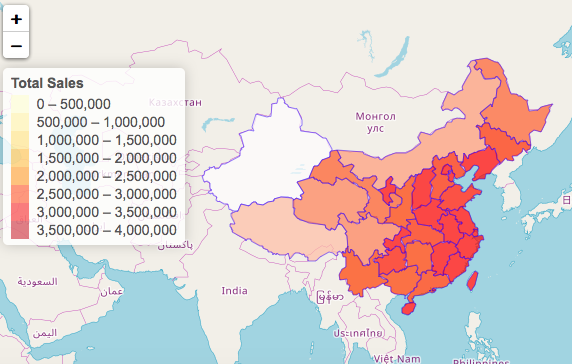
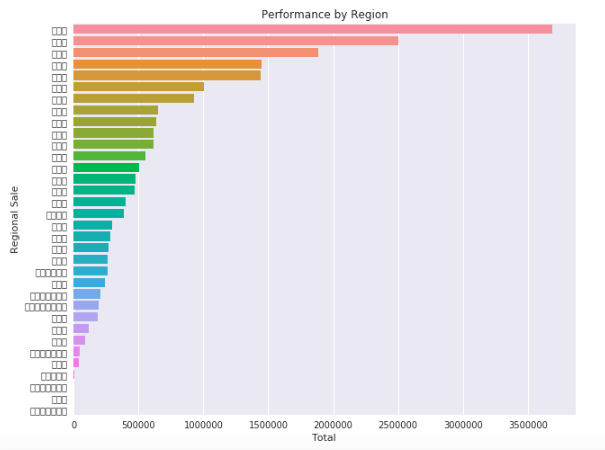
Top five provinces: JiangSu, Shanghai, Shandong, Guangdong
(江苏省 浙江省 上海市 山东省 广东省)
Top 5 provinces on the east coast generated 53% revenue
Sales -- By Product
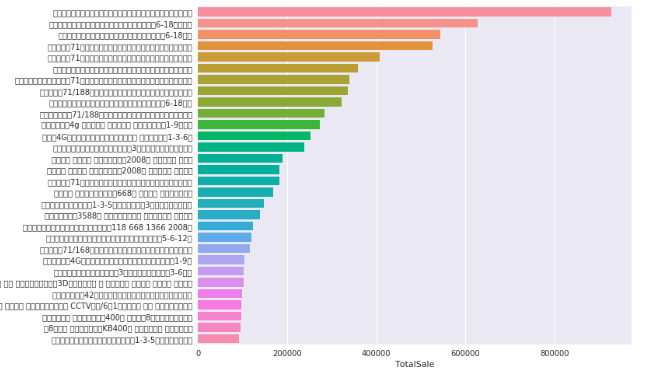
146,162 products sold which fall into 8439 distinct Items
The top 30 items generated 36.6% of revenue
Order Activity Pattern
Monthly Pattern

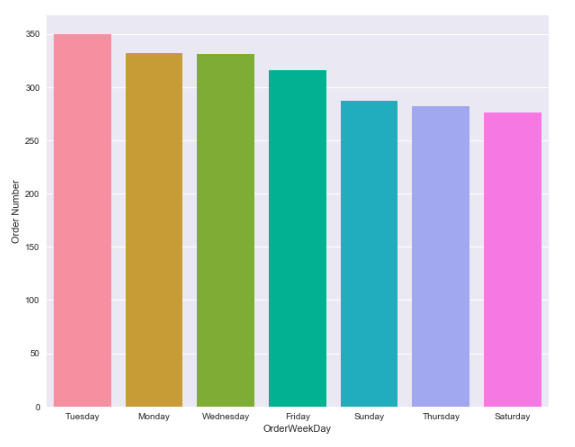
Weekly Pattern
Daily Pattern (2010~2019)
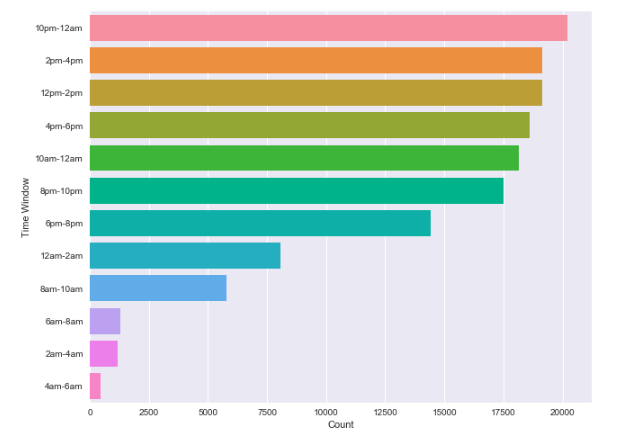
The most orders are generated in 10pm ~ 12am
Follows by lunch break 12pm~ 2pm
Daily Pattern (2019)
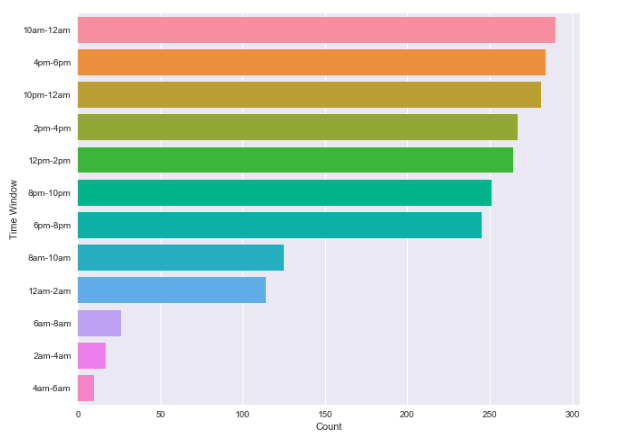
93.5% total orders were placed by cell phone
37% orders fell into 6pm-12am
Order Placement & Payment Process
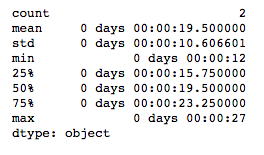
Average: 19.5 seconds
Maximum: 27 seconds
Visitor & Customer Behavior
Visitor Behavior

Customer Behavior
117,678 registered customers
26,252 Customers came back & bought one or more other items in 30 days
77.7% customers left after first purchase
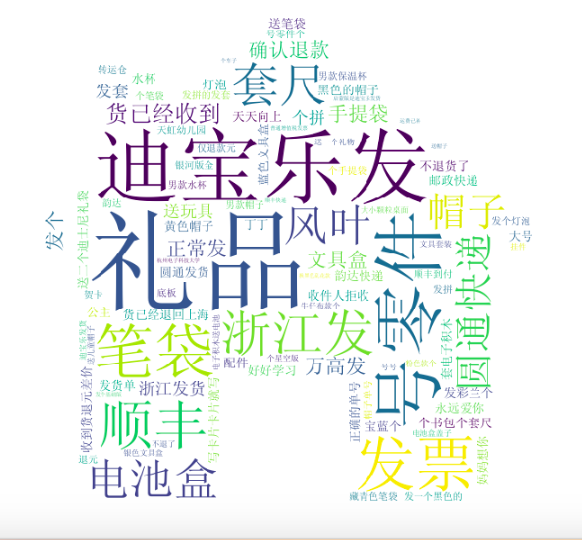
Customer Review - Word Cloud
General Observations:
- Best performance 2015
- Bad performance 2016
- Sales volume clearly declined in 2019
- Top 5 selling regions are on the east coast and generated 53% of total sales. (there are 35 provinces + admin territories in China)
- Top 30 products out of 8439 (distinct) generated 36% of total sales
- less than 2% of the visitors actually converted to a customer
- 77.7% customers left after purchased the first item
- Average time from order placement to payment is 19.5 seconds
Industrial Comparison
We did research and acquired 2017 ~ 2019 data of both industrial average performance and of the top 10% competitors' performance. Thus we made the following comparison:
Visitor Conversion Rate
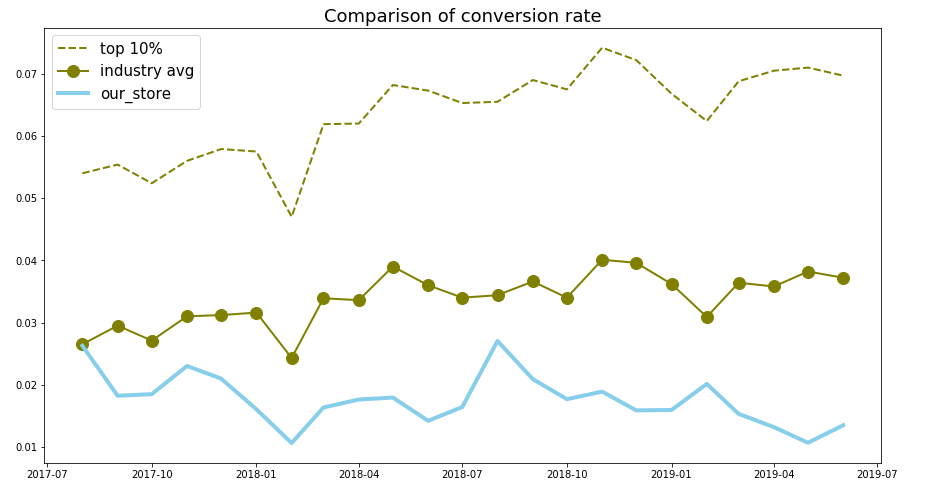
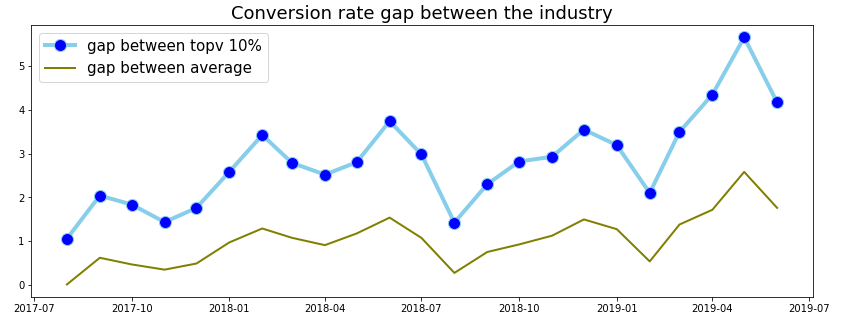
The biggest gap is more than 5 times
Gap = (TOP(AVG) CVR - HT_CVR)/ HT_CVR
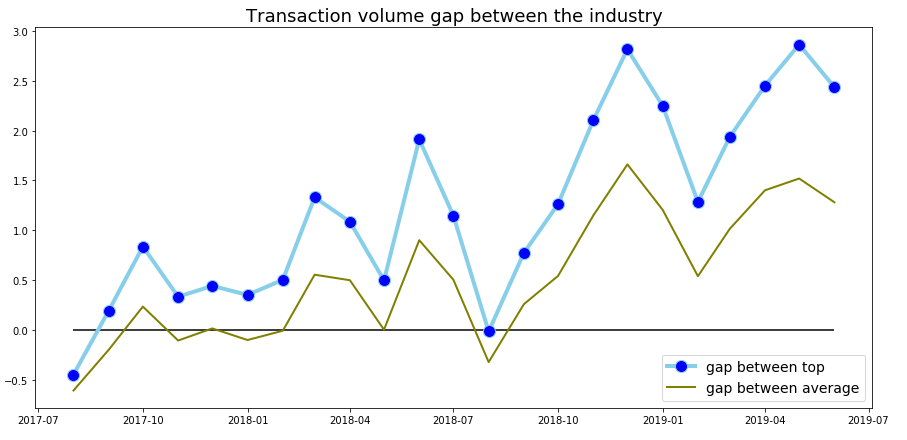
Transaction Volume
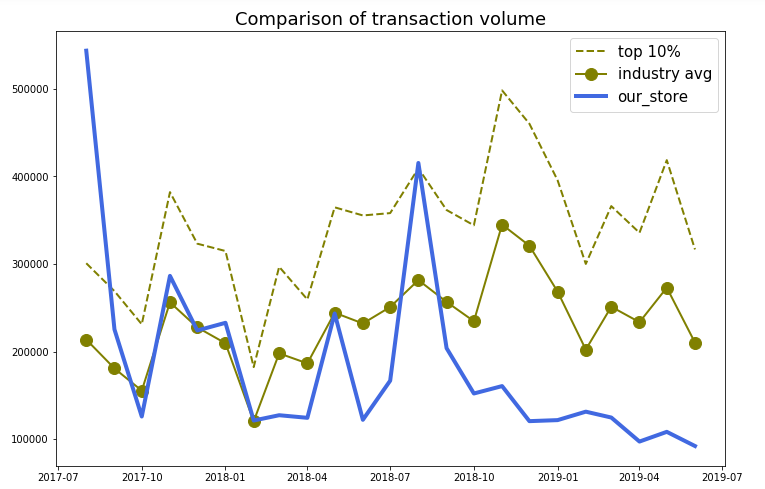
Performance clearly bellows industrial Average
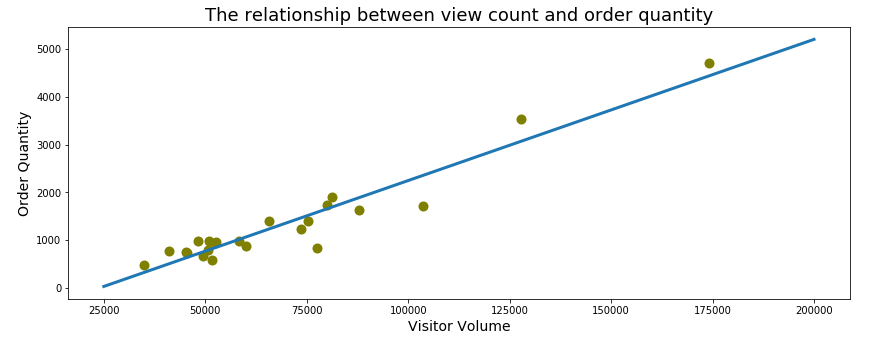
Increase visitor volume
Increase order quantity / visitor
Conclusions:
- HT visitor conversion rate is very much below the industrial average level for instance in 2018: 1.76% vs 3.38%. If HT can improve its conversion rate to industrial level, with an assumed profit rate 10%, HT can bring in extra profit ¥193,386.53
- HT transaction volume is clearly below the industrial average performance
HT can invest in Tmall promotion to increase the number of visitors thus increase sales. Here for this project, we focus on current customers: convert inactive customer to active customer and increase per customer sales.
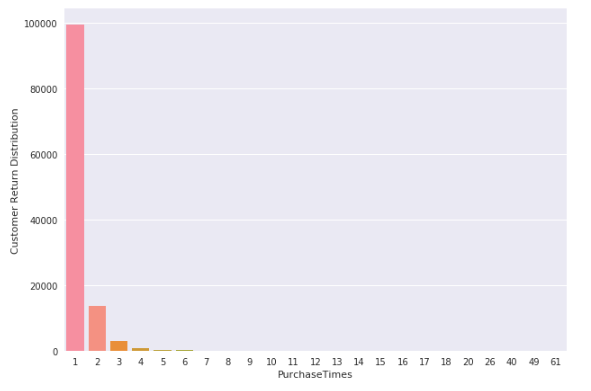
Customer Retention
1. Return Pattern
- 117,678 Customers
- 22,969 Customers came back in 30 days
- 26,252 Customers came back and bought other items
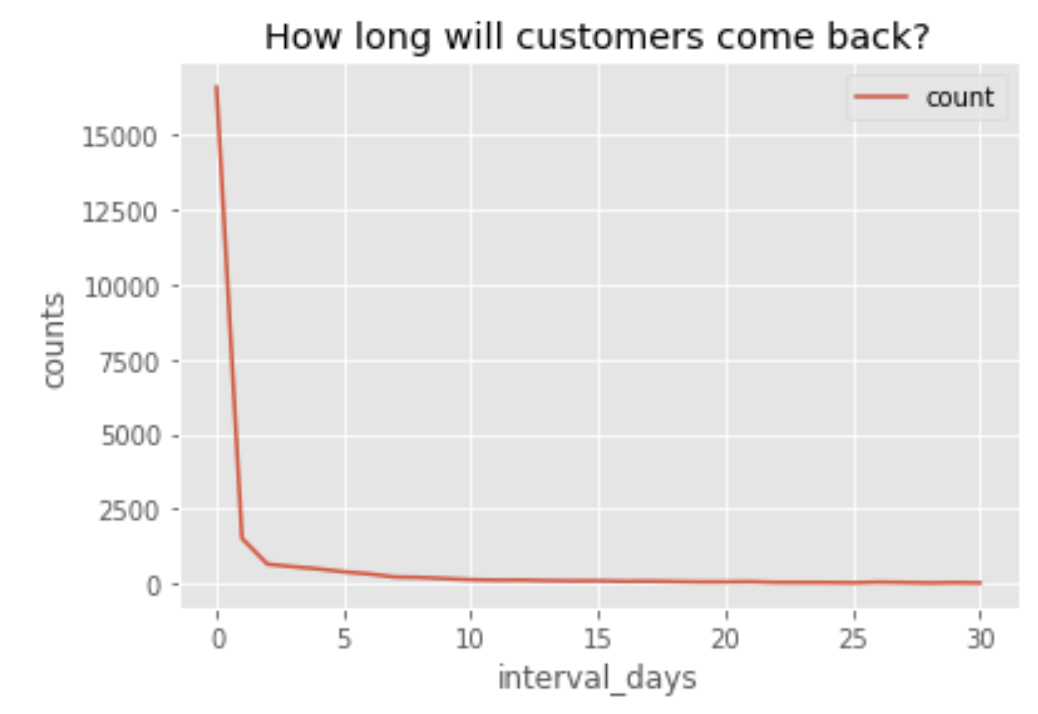
We can see from the graph that most customers purchased the second item in 30 days time period. If we can predict the possibility of the return of a customer, then we can follow up with specific policy to encourage the return. Thus increase per customer transactions.
2. Customer Retention Prediction
- Objective : Predict the probability of consumer return rate in a 30 day period.
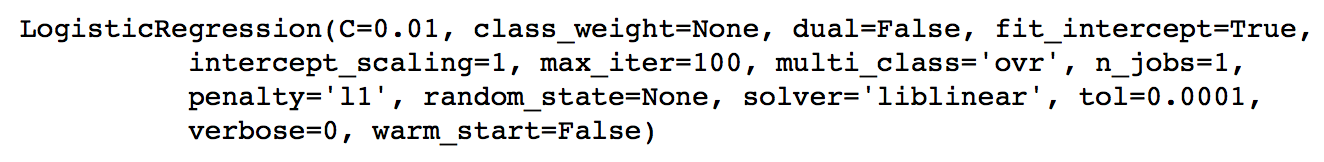
- Model : Logistic Regression
- Result :
| Predict 0 | Predict 1 | |
| True 0 | 78731 | 2930 |
| True 1 | 11318 | 4317 |
- 0: Not come back in 30 days
- 1: Come back in 30 days
- Accuracy: 85%
- Recall = TP/(TP+FN) = 28%
We first split the dataset to 80% : 20% and created a logistic regression classifier with the training set. The prediction on a customer's return in 30 days period on the test dataset shows in the table shows an accuracy of 85% but poorly on Recall which is TP/(TP+FN) = 28%. What cause this poor performance ?
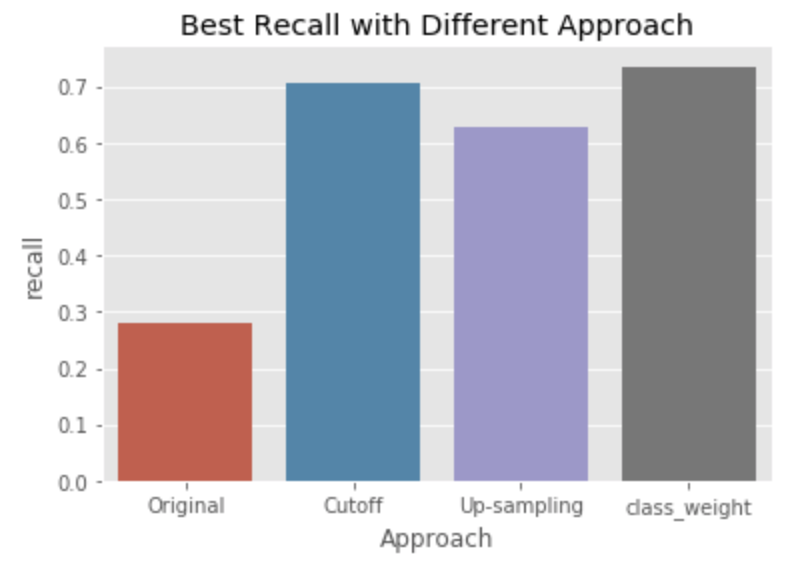
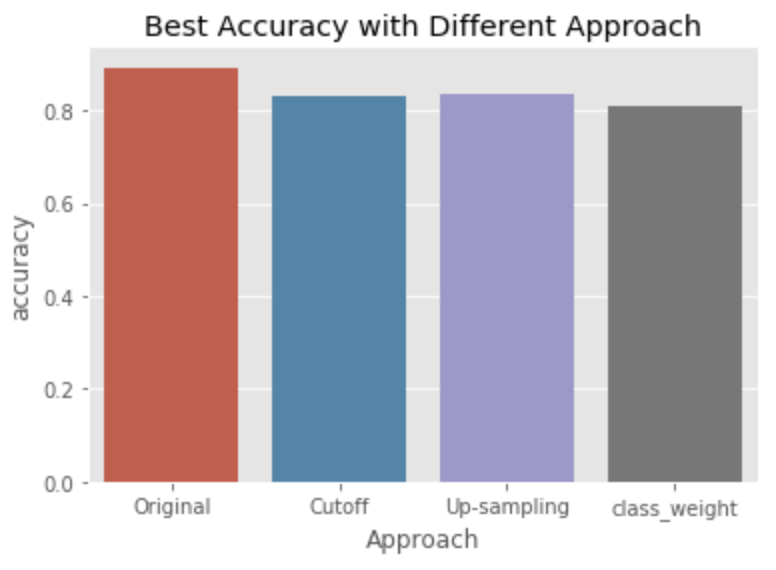
Recall that 77.7% of the customers never came back after the first purchase. This indicates that the our dataset is very imbalanced between return & non_return which is 77.7 : 22.3. In this case, we tried three mathematical techniques to improve the efficiency of the model
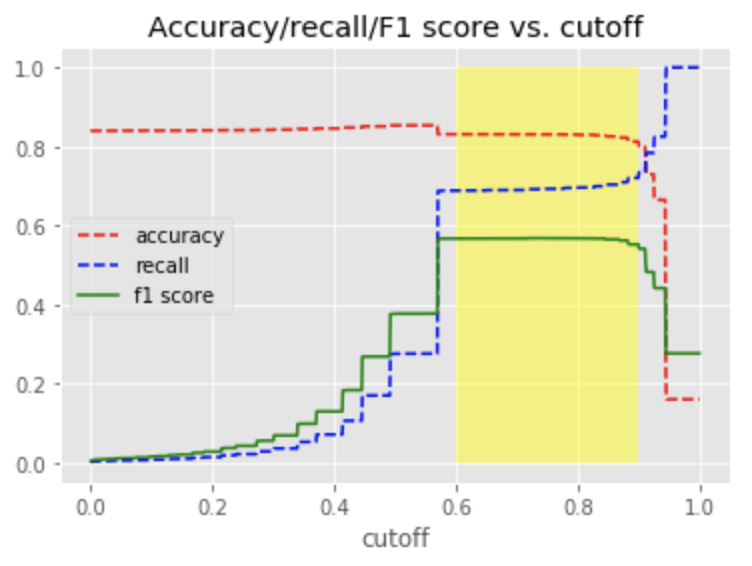
1. Cut off
2. Up-sampling
The theory is to fabricate synthesized minority class data to reduce the imbalance between the majority and minority data. return. In this case, we up-sampling bootstraps only the return customer samples to make the major:minor ratio more balanced.
3. Class_Weight
3.Market Basket Analysis
- Market basket analysis
- Uncover associations between items
- Looking for combinations that occur together frequently
- Provide information about purchase behavior
- Use NLP on Itemname
- Create 8 most popular categories
- 93% item names are in those categories
- Use 1 or 0 to represent each consumer’s purchase behavior
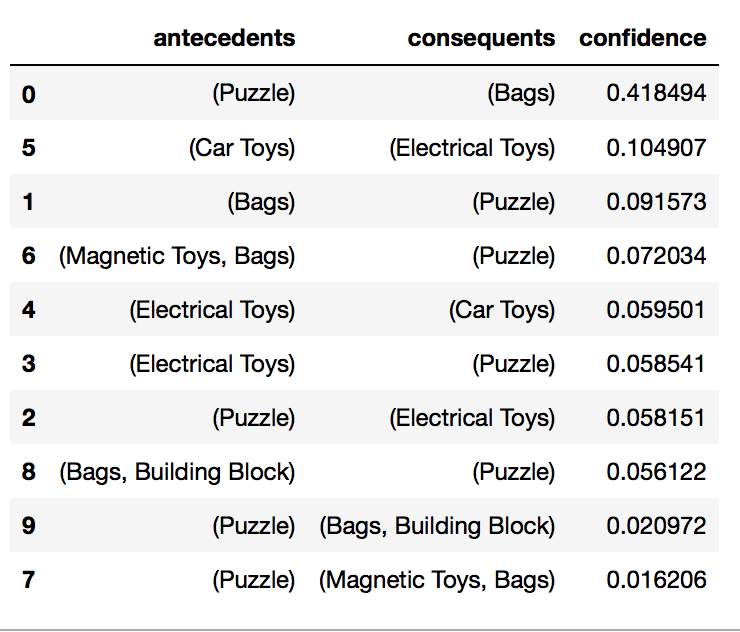
- Apriori algorithm
- Calculate confidence of buying 2 products together
- Rank top 10 confidence results
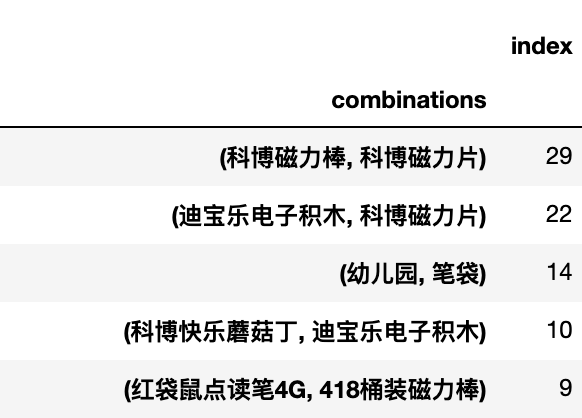
Also with data engineering, we were able to locate total 482 product combinations customers purchased and found 84 most popular combinations.
With the above tools, we will be able to follow up with specific promotion policy to encourage the potential purchase of the current customers.
Recommendations
- UI structures & features improvement
- Especially item interface pulled by search engine on the platform.
- Research on the top competitors’ design performance
Convert more random visitors to customers
2. Inactive customer recover
- Database
- Promotion policies accordingly
- Reach out to customers
Bring inactive accounts back to life
3. Set up customer loyalty reward system
- Accumulated purchase amount - wholesale customer
- Accumulated purchase times - retail customer
Drive increasing activities on the active accounts
4. Set up a systematic filing & tracking system
- Customer follow up
- Customer feedback
- Birthday gifts (such as store branded backpack hanging toys. For different ages)
Maintain & increase customer satisfaction rate
5. Research on tmall.com promotion policies
- Target windows
- Target customer groups
- Target season
Generate higher visitor traffic
Further Research Suggestion
1.Further analysis with AB test on UI
Deep research on top competitors UI: page structure, graphic, promotion, product group and item links etc. Thus create systematic AB test plans
2.Further analysis on the 8400 accumulated sold items with NLP
Add catch more features such as age group to the item groups; Together with improved logistic regression model to form a more efficient and accurate group product recommendation system
3.Further analysis on customer reviews with NLP
Help determine more effective marketing approaches
4.Further analysis into the regional features
Between east coast (top 5 provinces, 53% revenue) & western regions(30 province, 47% revenue) to drive regional expansion into the vast western market
5.Further analysis into city & town level sales density
Indications of group customer influences such as school clusters. Thus specific regional group marketing plan may be considered: such as the purchased backpack being delivered with store branded fashion toys (hanging on backpack) .