NYC Data Science Academy| Blog
Bootcamps
Lifetime Job Support Available Financing Available
Bootcamps
Data Science with Machine Learning Flagship ๐Ÿ† Data Analytics Bootcamp Artificial Intelligence Bootcamp New Release ๐ŸŽ‰
Free Lesson
Intro to Data Science New Release ๐ŸŽ‰
Find Inspiration
Find Alumni with Similar Background
Job Outlook
Occupational Outlook Graduate Outcomes Must See ๐Ÿ”ฅ
Alumni
Success Stories Testimonials Alumni Directory Alumni Exclusive Study Program
Courses
View Bundled Courses
Financing Available
Bootcamp Prep Popular ๐Ÿ”ฅ Data Science Mastery Data Science Launchpad with Python View AI Courses Generative AI for Everyone New ๐ŸŽ‰ Generative AI for Finance New ๐ŸŽ‰ Generative AI for Marketing New ๐ŸŽ‰
Bundle Up
Learn More and Save More
Combination of data science courses.
View Data Science Courses
Beginner
Introductory Python
Intermediate
Data Science Python: Data Analysis and Visualization Popular ๐Ÿ”ฅ Data Science R: Data Analysis and Visualization
Advanced
Data Science Python: Machine Learning Popular ๐Ÿ”ฅ Data Science R: Machine Learning Designing and Implementing Production MLOps New ๐ŸŽ‰ Natural Language Processing for Production (NLP) New ๐ŸŽ‰
Find Inspiration
Get Course Recommendation Must Try ๐Ÿ’Ž An Ultimate Guide to Become a Data Scientist
For Companies
For Companies
Corporate Offerings Hiring Partners Candidate Portfolio Hire Our Graduates
Students Work
Students Work
All Posts Capstone Data Visualization Machine Learning Python Projects R Projects
Tutorials
About
About
About Us Accreditation Contact Us Join Us FAQ Webinars Subscription An Ultimate Guide to
Become a Data Scientist
    Login
NYC Data Science Acedemy
Bootcamps
Courses
Students Work
About
Bootcamps
Bootcamps
Data Science with Machine Learning Flagship
Data Analytics Bootcamp
Artificial Intelligence Bootcamp New Release ๐ŸŽ‰
Free Lessons
Intro to Data Science New Release ๐ŸŽ‰
Find Inspiration
Find Alumni with Similar Background
Job Outlook
Occupational Outlook
Graduate Outcomes Must See ๐Ÿ”ฅ
Alumni
Success Stories
Testimonials
Alumni Directory
Alumni Exclusive Study Program
Courses
Bundles
financing available
View All Bundles
Bootcamp Prep
Data Science Mastery
Data Science Launchpad with Python NEW!
View AI Courses
Generative AI for Everyone
Generative AI for Finance
Generative AI for Marketing
View Data Science Courses
View All Professional Development Courses
Beginner
Introductory Python
Intermediate
Python: Data Analysis and Visualization
R: Data Analysis and Visualization
Advanced
Python: Machine Learning
R: Machine Learning
Designing and Implementing Production MLOps
Natural Language Processing for Production (NLP)
For Companies
Corporate Offerings
Hiring Partners
Candidate Portfolio
Hire Our Graduates
Students Work
All Posts
Capstone
Data Visualization
Machine Learning
Python Projects
R Projects
About
Accreditation
About Us
Contact Us
Join Us
FAQ
Webinars
Subscription
An Ultimate Guide to Become a Data Scientist
Tutorials
Data Analytics
  • Learn Pandas
  • Learn NumPy
  • Learn SciPy
  • Learn Matplotlib
Machine Learning
  • Boosting
  • Random Forest
  • Linear Regression
  • Decision Tree
  • PCA
Interview by Companies
  • JPMC
  • Google
  • Facebook
Artificial Intelligence
  • Learn Generative AI
  • Learn ChatGPT-3.5
  • Learn ChatGPT-4
  • Learn Google Bard
Coding
  • Learn Python
  • Learn SQL
  • Learn MySQL
  • Learn NoSQL
  • Learn PySpark
  • Learn PyTorch
Interview Questions
  • Python Hard
  • R Easy
  • R Hard
  • SQL Easy
  • SQL Hard
  • Python Easy
Data Science Blog > Machine Learning > Home Data Analysis: Fitting Towards Ames

Home Data Analysis: Fitting Towards Ames

Dmitri Levonian and Robert Atuahene
Posted on Jun 7, 2020
The skills I demoed here can be learned through taking Data Science with Machine Learning bootcamp with NYC Data Science Academy.
  • project github

Introduction

Online real estate listing companies like Zillow, Trulia and Redfin each provide a home value estimator which is their estimate of how much a home is worth using their internal models. 

The Zestimate from Zillow is among the most popular in the industry. While millions of homeowners, real estate agents and investors use the Zestimate as a benchmark to price a home, their pricing model is still proprietary. Thus users do not have adequate visibility into which aspects of their home or neighborhood most influence the Zestimate. What's more, oftentimes, homeowners are left wondering if the Zestimate is correctly pricing their homes. 

Our objective therefore was to come up with a pricing model that values homes in the city of Ames more accurately than the Zestimate and to provide greater transparency to homeowners. By applying local knowledge of the housing market in Ames and fitting machine learning models to the local real estate market, we believe we can create a home value estimator with a higher explanatory power and greater transparency. 

A table of initial results below shows how competitive our model is using results from our cross-validated training dataset:

Before we dive into Ames and its real estate, let's also note that the Ames housing dataset comes from the city's property assessor's office, is fully public and easy to scrape. Zillow says it collects all relevant public data for each individual property, which makes our accuracy directly comparable to Zillow's. 

Ames and the real estate context

Working with a housing dataset has one clear advantage: everyone can relate to the data and understand most features. We decided to explore the real-life context of Ames and its real estate market to get more intuition about the factors that determine house pricing.

Amesโ€™ demographics, economy, quality of life and virtually any other aspect of the town is defined by the Iowa State University, a large public research university. Over 75% of Ames is either studying or working at the ISU, which makes the town essentially one large extended campus:

As in most college towns, the real estate market is defined by a very large proportion of rental properties. The income they generate depends eventually on the ISUโ€™s annual budget, which helps explain the amazing stability of house prices (as well as transaction volumes) in Ames.

The Ames data was collected in 2006-2010 and this was a very turbulent time in the U.S. real estate (and the economy in general). However, none of that volatility has taken place in Ames:

From the machine learning standpoint, such price stability means we cannot extract useful information from the timing of the transaction.

The last observation regarding the Ames real estate picture is that the dataset includes homes from very different price segments, ranging from upscale neighborhoods with $300,000 homes next to a golf course to the neighborhoods with $100,000 homes next to the airport.

The neighborhood and the zoning category strongly influence the house prices and came up as important features in all our pricing models:

However, it is difficult for an algorithm to predict prices equally well for the entire spectrum. Our models perform better in the middle segments, where more transaction data is available. Note that it would be difficult for a human real estate agent to know all these different segments equally well, real estate agents tend to specialize.

Exploring the Data

The Ames housing dataset contains 2,919 homes evenly split into train (1,460) and test (1,459).  Each home is described by a collection of 79 features (excluding ID), ranging from square footage to location to some elementsโ€™ quality estimated by the tax assessor.  This is quite a rich feature set which is why it explains about 92% of the variability in the sale prices, as we will see below.

Because we have such different market segments in the dataset, the relationship between the sale price and the above ground living shows a good deal of variability. For example, a 1,500 sq.ft home can cost anywhere from $100,000 or $250,00. We also observe a significant fanning effect: the prices vary more for the larger, more expensive homes.

To compensate for this and make the price distribution closer to a normal distribution, we take the logarithm of the price and make it the target variable in all our models:

We have implemented a standard process of feature conversion, preprocessing, and imputation, which produced the features ready to be trained by ML models. After such preprocessing, some of the most influential features such as Overall quality, Kitchen quality, Exterior quality exhibit strong linear relationship with the Log Price:

Modeling and Prediction Accuracy

Since the log price has a strong linear relationship with many predictors, we decided to deploy a few penalized linear models. We also implemented gradient boosted trees hoping to catch non-linearities or hidden feature interactions.

For each model, the best hyperparameters were determined through cross-validation, which estimated the actual out-of-sample metrics quite accurately. The optimization of the ridge linear model is shown as an example below, with the best R2 at about 92% and the best RMSE of the log price at 0.117.

The Ames housing dataset is sparse  - only 1,460 training samples - and thatโ€™s why the standard errors for the R2 and RMSE (the grey bands on the charts) are quite significant.

We optimized three models: LASSO, Ridge, and XGBoost. Although cross-validated performance was better for XGBoost, the test set metric (Kaggle score) was almost identical for all three models.  This disparity was probably the result of overfitting the numerous hyperparameters for XGBoost, and the dataset is too small to allow for a proper train/validation/test split to avoid such overfitting.

We also deployed an ensemble of XGBoost and Ridge, and it showed the best results: 0.1169 RMSLE. The ensembling performed well apparently because the two components came from completely different families.

Our best result placed the team in the top 8% on Kaggle. However, this accuracy should be put in context. Improving the RMSLE by say another 0.002 would place us at the top-4% but, for an average house in Ames, this is equivalent to improving the prediction by a mere $160. Such fluctuations in price have to do more with noise than anything else.

To explain the remaining variability, machine learning models would need more data and more features, many of which are not accounted for by the Ames' property assessor office.

Insights - Value Proposition

While model results are impressive, we want to make sure the results are tangible to homeowners, local real estate agents and investors in the Ames housing market. To give that specific audience the needed transparency, we ranked the top features that contribute the most to the value of a home according to our best pricing model:

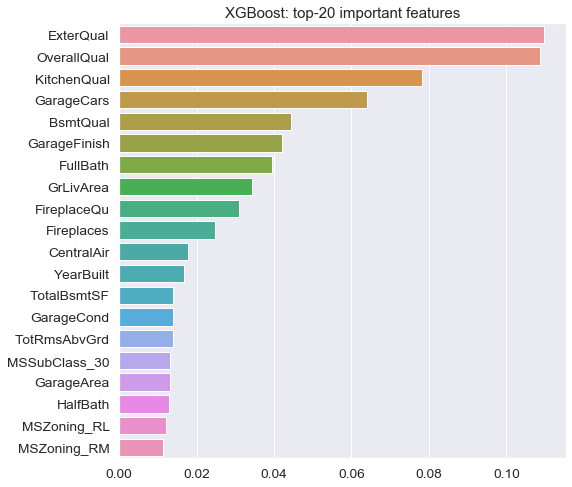
It comes as no surprise that overall home quality, condition, size and zoning are among the top influential features. Interestingly though, fireplaces and central air conditioning are important as well, perhaps due to the harsher winter conditions in the mid-west.

Re-assessing the best model

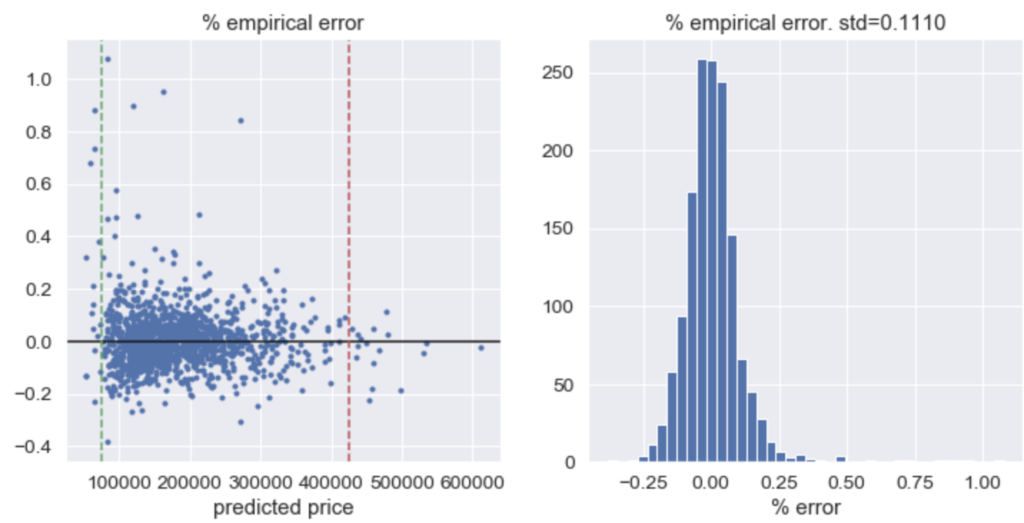
Even though our model performed well on the test (out of sample) data, we note that it tends to overprice lower value homes and undershoots at the higher end of the price spectrum as shown in the plots of residuals below. The market seems to demand an extra discount for the cheapest houses and on the other hand, extra premium for the most expensive ones.

Conclusions

We can increase the prediction accuracy of our model in a couple of ways:

  1. Increasing the explanatory power through:
  • Price segmentation and fitting to each price segment
  • Adding more observations particularly to the tails of the house price spectrum. We note that this project only used sales data from 2006 - 2010.
  1. Adding more recent and non-standard features such as:
  • Major upgrades to a home or immediate surroundings
  • New developments that influence the desirability of a neighborhood
  • Recent re-zoning
  • More specific location data (e.g. near busy road or a frat house vs. close to a waterfront)

However non-standard data is harder and often pricier to obtain. Furthermore, price segmentation will increase the complexity of our model and make it harder to interpret results to homeowners.

Therefore, we conclude that our current model achieves a good balance between complexity and transparency while maintaining an accuracy competitive with the industry standard.

About Authors

Dmitri Levonian

Dmitri has managed diverse private assets in Europe for the past 15 years. He is a practitioner of deep learning and member of the TensorFlow Certificate network.
View all posts by Dmitri Levonian >

Robert Atuahene

Financial services executive with extensive experience in trading and risk management of listed derivatives. Excited about opportunities to apply data science to the financial services domain and beyond!
View all posts by Robert Atuahene >

Leave a Comment

No comments found.

View Posts by Categories

All Posts 2399 posts
AI 7 posts
AI Agent 2 posts
AI-based hotel recommendation 1 posts
AIForGood 1 posts
Alumni 60 posts
Animated Maps 1 posts
APIs 41 posts
Artificial Intelligence 2 posts
AWS 13 posts
Banking 1 posts
Big Data 50 posts
Branch Analysis 1 posts
Capstone 206 posts
Career Education 7 posts
CLIP 1 posts
Community 72 posts
Congestion Zone 1 posts
Content Recommendation 1 posts
Cosine SImilarity 1 posts
Data Analysis 5 posts
Data Engineering 1 posts
Data Engineering 3 posts
Data Science 7 posts
Data Science News and Sharing 73 posts
Data Visualization 324 posts
Events 5 posts
Featured 37 posts
Function calling 1 posts
FutureTech 1 posts
Generative AI 5 posts
Hadoop 13 posts
Image Classification 1 posts
Innovation 2 posts
Kmeans Cluster 1 posts
LLM 6 posts
Machine Learning 364 posts
Marketing 1 posts
Meetup 144 posts
MLOPs 1 posts
Model Deployment 1 posts
Nagamas69 1 posts
NLP 1 posts
OpenAI 5 posts
OpenNYC Data 1 posts
pySpark 1 posts
Python 16 posts
Python 458 posts
Python data analysis 4 posts
Python Shiny 2 posts
R 404 posts
R Data Analysis 1 posts
R Shiny 560 posts
R Visualization 445 posts
RAG 1 posts
RoBERTa 1 posts
semantic rearch 2 posts
Spark 17 posts
SQL 1 posts
Streamlit 2 posts
Student Works 1687 posts
Tableau 12 posts
TensorFlow 3 posts
Traffic 1 posts
User Preference Modeling 1 posts
Vector database 2 posts
Web Scraping 483 posts
wukong138 1 posts

Our Recent Popular Posts

AI 4 AI: ChatGPT Unifies My Blog Posts
by Vinod Chugani
Dec 18, 2022
Meet Your Machine Learning Mentors: Kyle Gallatin
by Vivian Zhang
Nov 4, 2020
NICU Admissions and CCHD: Predicting Based on Data Analysis
by Paul Lee, Aron Berke, Bee Kim, Bettina Meier and Ira Villar
Jan 7, 2020

View Posts by Tags

#python #trainwithnycdsa 2019 2020 Revenue 3-points agriculture air quality airbnb airline alcohol Alex Baransky algorithm alumni Alumni Interview Alumni Reviews Alumni Spotlight alumni story Alumnus ames dataset ames housing dataset apartment rent API Application artist aws bank loans beautiful soup Best Bootcamp Best Data Science 2019 Best Data Science Bootcamp Best Data Science Bootcamp 2020 Best Ranked Big Data Book Launch Book-Signing bootcamp Bootcamp Alumni Bootcamp Prep boston safety Bundles cake recipe California Cancer Research capstone car price Career Career Day ChatGPT citibike classic cars classpass clustering Coding Course Demo Course Report covid 19 credit credit card crime frequency crops D3.js data data analysis Data Analyst data analytics data for tripadvisor reviews data science Data Science Academy Data Science Bootcamp Data science jobs Data Science Reviews Data Scientist Data Scientist Jobs data visualization database Deep Learning Demo Day Discount disney dplyr drug data e-commerce economy employee employee burnout employer networking environment feature engineering Finance Financial Data Science fitness studio Flask flight delay football gbm Get Hired ggplot2 googleVis H20 Hadoop hallmark holiday movie happiness healthcare frauds higgs boson Hiring hiring partner events Hiring Partners hotels housing housing data housing predictions housing price hy-vee Income industry Industry Experts Injuries Instructor Blog Instructor Interview insurance italki Job Job Placement Jobs Jon Krohn JP Morgan Chase Kaggle Kickstarter las vegas airport lasso regression Lead Data Scienctist Lead Data Scientist leaflet league linear regression Logistic Regression machine learning Maps market matplotlib Medical Research Meet the team meetup methal health miami beach movie music Napoli NBA netflix Networking neural network Neural networks New Courses NHL nlp NYC NYC Data Science nyc data science academy NYC Open Data nyc property NYCDSA NYCDSA Alumni Online Online Bootcamp Online Training Open Data painter pandas Part-time performance phoenix pollutants Portfolio Development precision measurement prediction Prework Programming public safety PwC python Python Data Analysis python machine learning python scrapy python web scraping python webscraping Python Workshop R R Data Analysis R language R Programming R Shiny r studio R Visualization R Workshop R-bloggers random forest Ranking recommendation recommendation system regression Remote remote data science bootcamp Scrapy scrapy visualization seaborn seafood type Selenium sentiment analysis sentiment classification Shiny Shiny Dashboard Spark Special Special Summer Sports statistics streaming Student Interview Student Showcase SVM Switchup Tableau teachers team team performance TensorFlow Testimonial tf-idf Top Data Science Bootcamp Top manufacturing companies Transfers tweets twitter videos visualization wallstreet wallstreetbets web scraping Weekend Course What to expect whiskey whiskeyadvocate wildfire word cloud word2vec XGBoost yelp youtube trending ZORI

NYC Data Science Academy

NYC Data Science Academy teaches data science, trains companies and their employees to better profit from data, excels at big data project consulting, and connects trained Data Scientists to our industry.

NYC Data Science Academy is licensed by New York State Education Department.

Get detailed curriculum information about our
amazing bootcamp!

Please enter a valid email address
Sign up completed. Thank you!

Offerings

  • HOME
  • DATA SCIENCE BOOTCAMP
  • ONLINE DATA SCIENCE BOOTCAMP
  • Professional Development Courses
  • CORPORATE OFFERINGS
  • HIRING PARTNERS
  • About

  • About Us
  • Alumni
  • Blog
  • FAQ
  • Contact Us
  • Refund Policy
  • Join Us
  • SOCIAL MEDIA

    ยฉ 2025 NYC Data Science Academy
    All rights reserved. | Site Map
    Privacy Policy | Terms of Service
    Bootcamp Application