Game Analysis With Object Tracking
Object Tracking with Python Vision for Soccer Analysis

Introduction
This is not your father’s ball game. The ability to accurately and efficiently track objects, such as athletes, balls, and equipment, has revolutionized how sports are analyzed, broadcasted, and understood. In sports, object tracking technology enhances the viewing experience by providing real-time data and analytics that aids coaches and players in performance analysis and enables them to make better decision.s. Analyzing sports footage using a program with vision capabilities offers several compelling advantages that can significantly enhance both performance and understanding within the realm of sports. Some benefits it may include:
- Performance Improvement: A vision-based program can provide detailed, objective analysis of players' movements, techniques, and tactics. Coaches and athletes can use this data to identify strengths, weaknesses, and areas for improvement. For instance, analyzing the biomechanics of a tennis player's serve or a soccer player's dribbling technique can pinpoint inefficiencies that could be optimized through targeted training.
- Tactical Insights: Beyond individual performance, vision-based analysis can capture the dynamics of team play. It can track player positioning, movement patterns, and interactions during a game. This data is invaluable for coaches in planning team formations, assessing defensive and offensive strategies, and making informed tactical adjustments during matches.
- Objective Evaluation: Human perception can be limited and subjective. A program with vision provides an objective evaluation of various metrics, including speed, distance covered, ball trajectory, and reaction times. This objective data enhances the precision of performance assessments and reduces biases that might influence human observations.
- Real-Time Feedback: In competitive sports, real-time feedback is crucial for immediate adjustments. A vision-based program can analyze footage as it happens, providing instant insights into performance metrics. This allows coaches and players to make rapid decisions and corrections during training sessions or matches.
- Scouting and Recruitment: Vision-based analysis is also of great value for identifying talent identification and recruiting. . It allows scouts and recruiters to evaluate prospective players based on objective performance metrics and tactical acumen, supplementing traditional scouting methods with data-driven insights.
I developed a model using the YOLOv5. It takes a raw video as an input and outputs an mp4 file that identifies all the players, referees, and ball movements. It also tracks relevant player statistics like player movement speed and player distance moved. Although YOLOv8 is more advanced than YOLOv5, the earlier version has been found to be more accurate and better at object detection than YOLOv8. YOLOv9 and 10 are still in development and are not stable. The YOLO models are unique because they use a state of the art methodology of detecting objects. I used these libraries to create the model.
YOLO Model Timeline
The YOLO model, introduced by Joseph Redmon et al. in 2015, revolutionized real-time object detection. The first version, YOLOv1, offered a unified approach by framing object detection as a single regression problem, directly predicting bounding boxes and class probabilities from full images. The YOLO model has ten iterations. They are as follows:
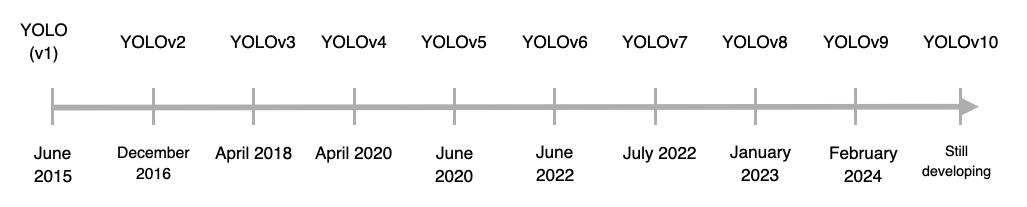
YOLOv1 (2015)
Design: YOLOv1 divides the input image into an SS grid. Each grid cell predicts bounding boxes, confidence scores, and class probabilities.
Advantages: Achieved real-time performance with 45 frames per second (fps) on a PASCAL VOC dataset, demonstrating that a single convolutional neural network (CNN) could effectively perform object detection.
YOLOv2 (2016) and YOLOv3 (2018)
YOLOv2: Also known as YOLO9000, this version improved upon YOLOv1 by introducing batch normalization, high-resolution classifier, anchor boxes, and multi-scale training. It could detect over 9000 object categories.
YOLOv3: Further enhanced accuracy and speed with a more sophisticated network, utilizing residual blocks, feature pyramid networks (FPN), and three different scales for detecting objects of varying sizes.
YOLOv4 and Beyond (2020 - Present)
YOLOv4: Introduced by Alexey Bochkovskiy et al., this iteration incorporated additional techniques like Cross Stage Partial connections (CSP), Mish activation function, and a new data augmentation technique called Mosaic.
YOLOv5: Developed by Ultralytics, it focuses on user-friendly implementation, providing pretrained models and easy-to-use scripts.
YOLOv6, YOLOv7, and YOLOv8: Continued advancements, each iteration aiming for better performance metrics (speed and accuracy) and ease of deployment in various applications. YOLOv8 was also developed by Ultralytics
YOLOv9:introduces innovative methods like Programmable Gradient Information (PGI) and the Generalized Efficient Layer Aggregation Network (GELAN).
YOLOv10: is created by researchers from Tsinghua University using the Ultralytics Python package. This version introduces real-time object detection advancements by introducing an End-to-End head that eliminates Non-Maximum Suppression (NMS) requirements.
Model and Libraries
Input
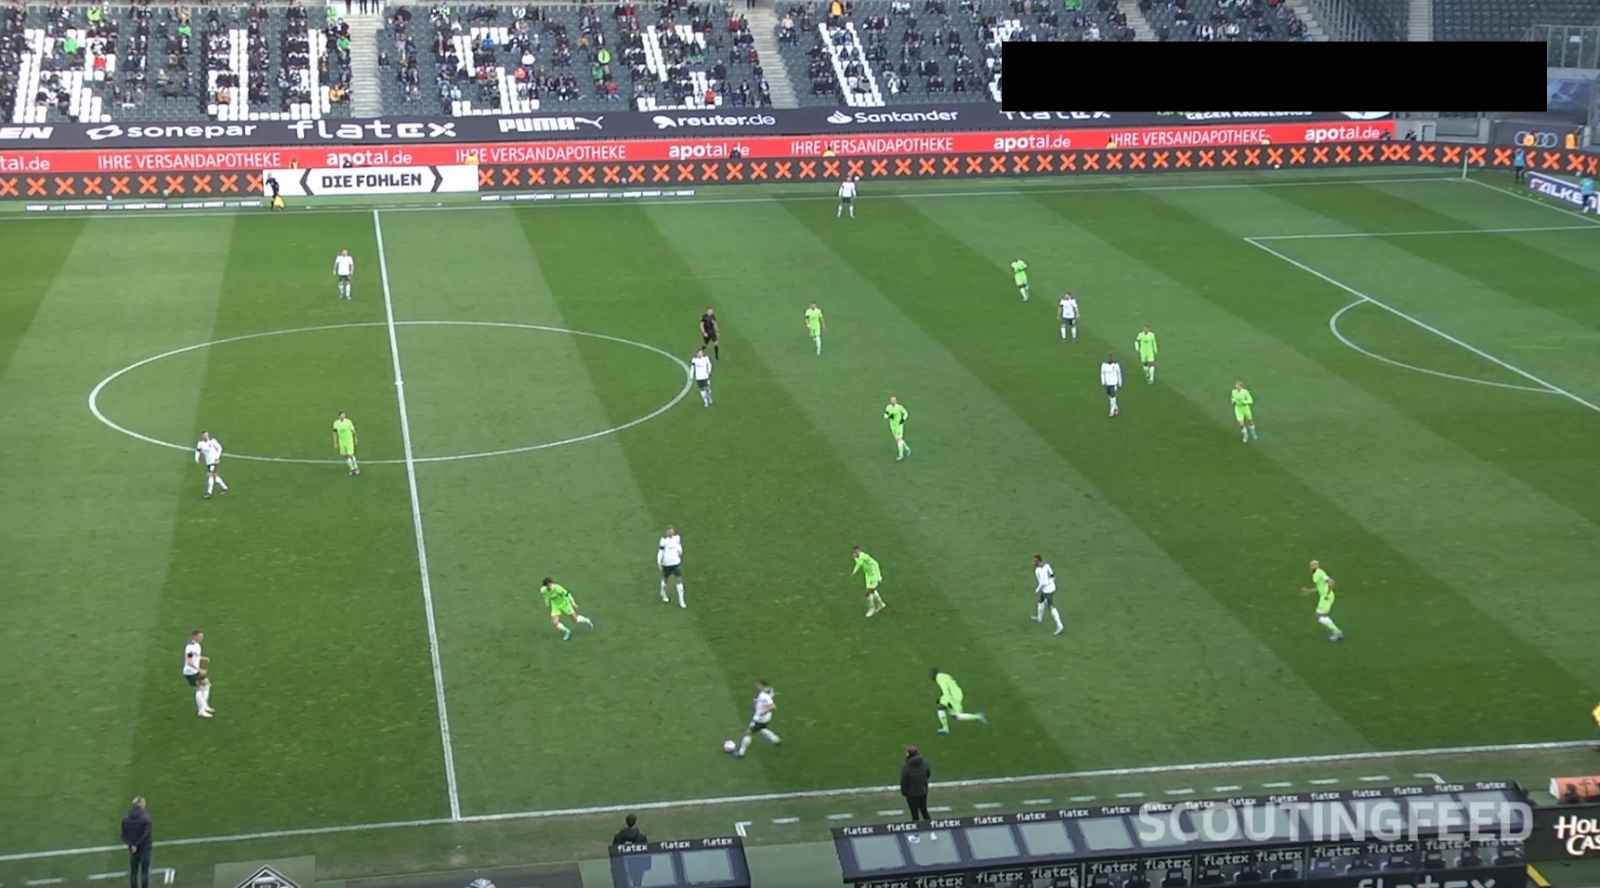
The input into this model is an mp4 file. However, other file types can also work as an input.
Base Model
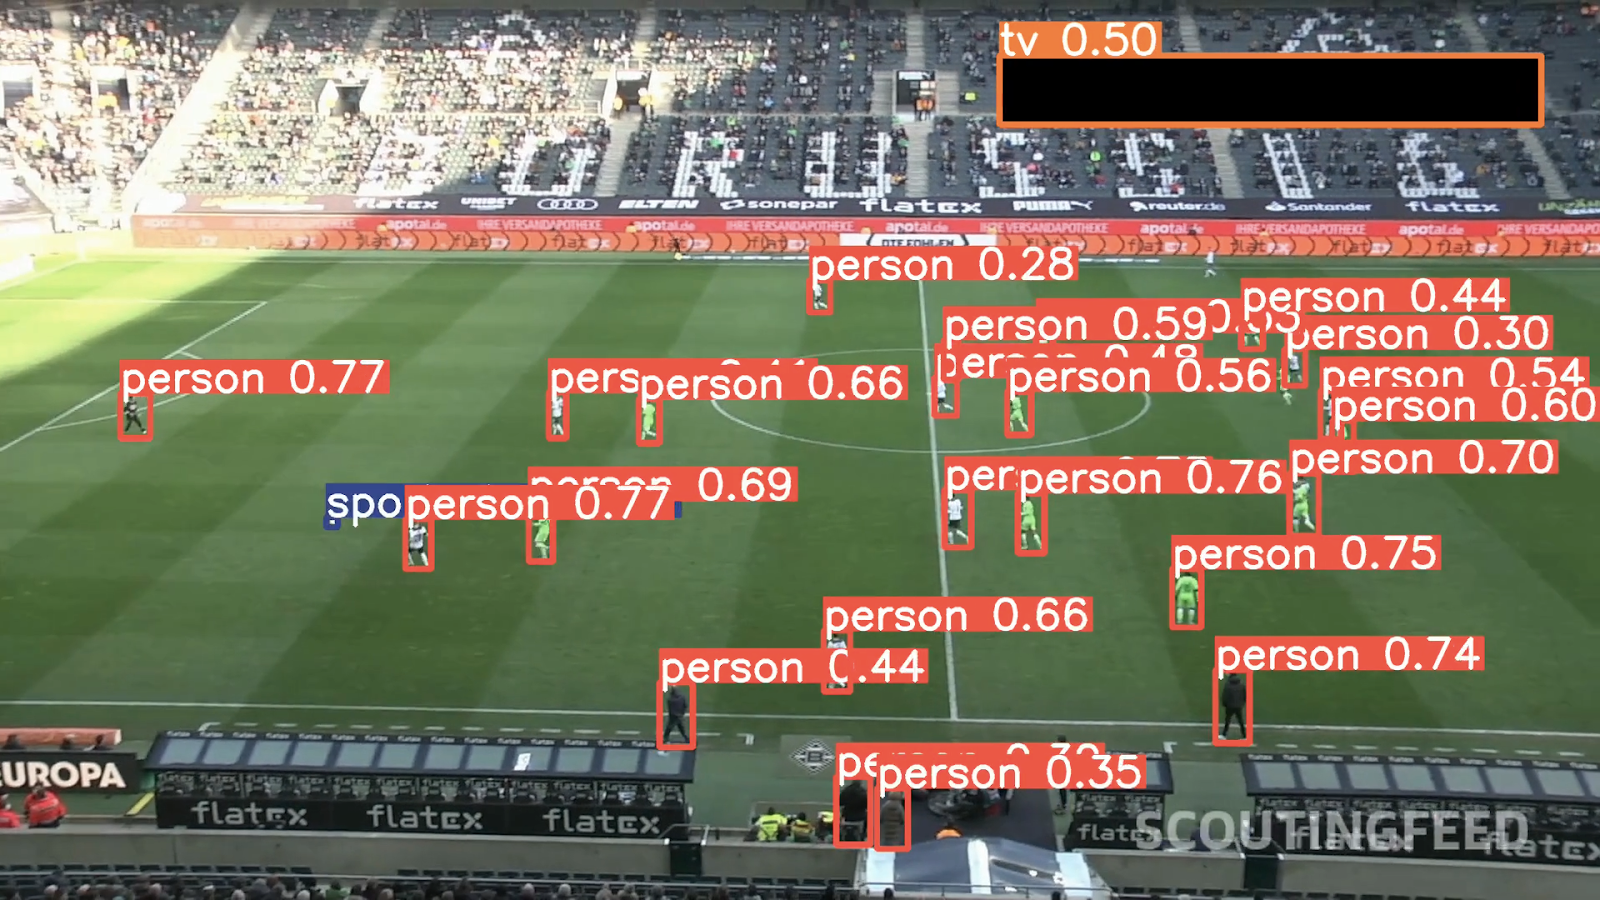
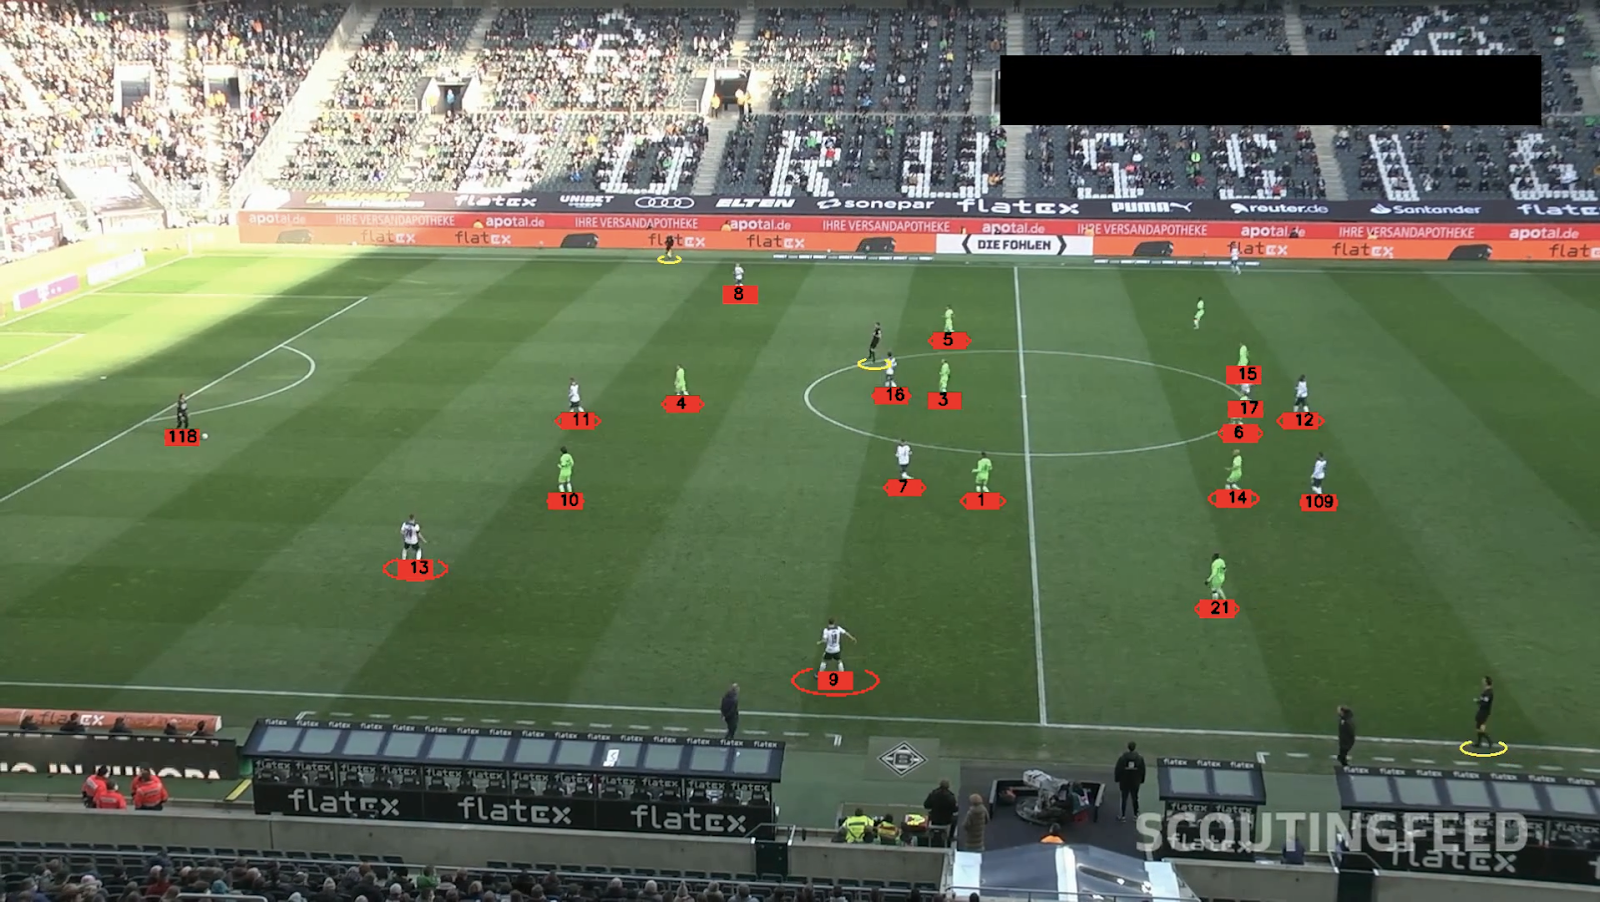
The image above shows the output for the base YOLOv5 model on the input video. Its output consists of three main items: the bounding box, object label, and confidence of the label. Notice that people on the sideline are also detected in the model. That bit of unnecessary detail creates noise for the model, which is not a good thing. Also note that the confidence the model has in each of its labels is not high. Finally, although not showcased in this photo, the ball is oftentimes lost in tracking.
Trained Model
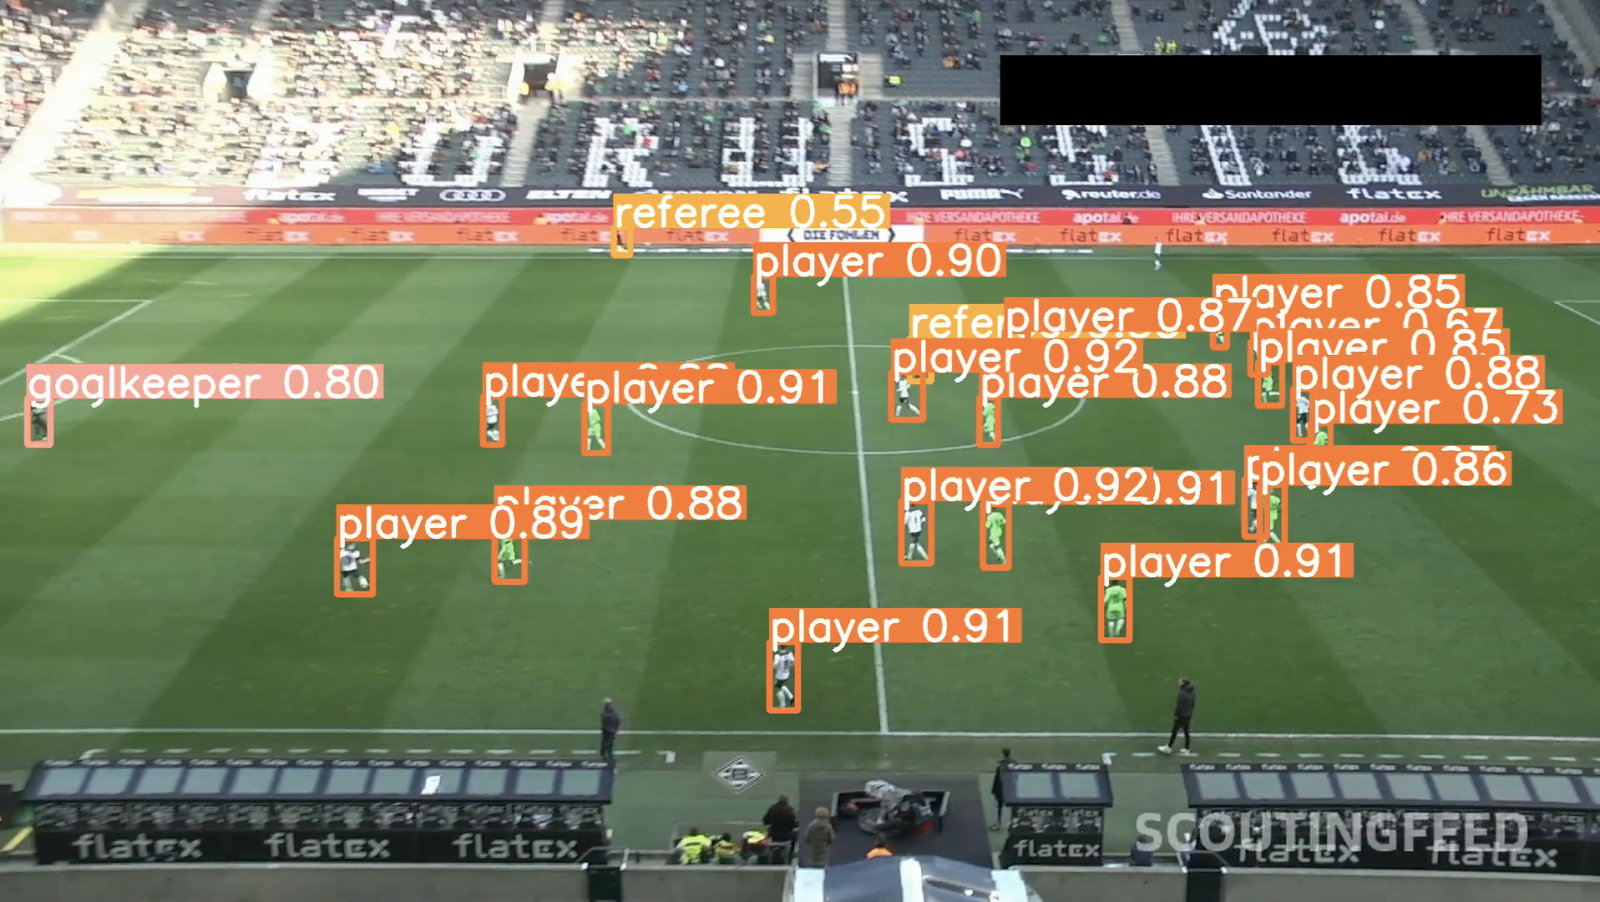
After the model was trained using Roboflow’s training data and Google Colab’s virtual GPU’s. Here we see that the confidence of each of the labels is higher. Also the people on the sideline are not detected anymore, and the object labels are changed from “person” to “player”. However, the issue of losing the ball detection still persists.
More User Friendly Model
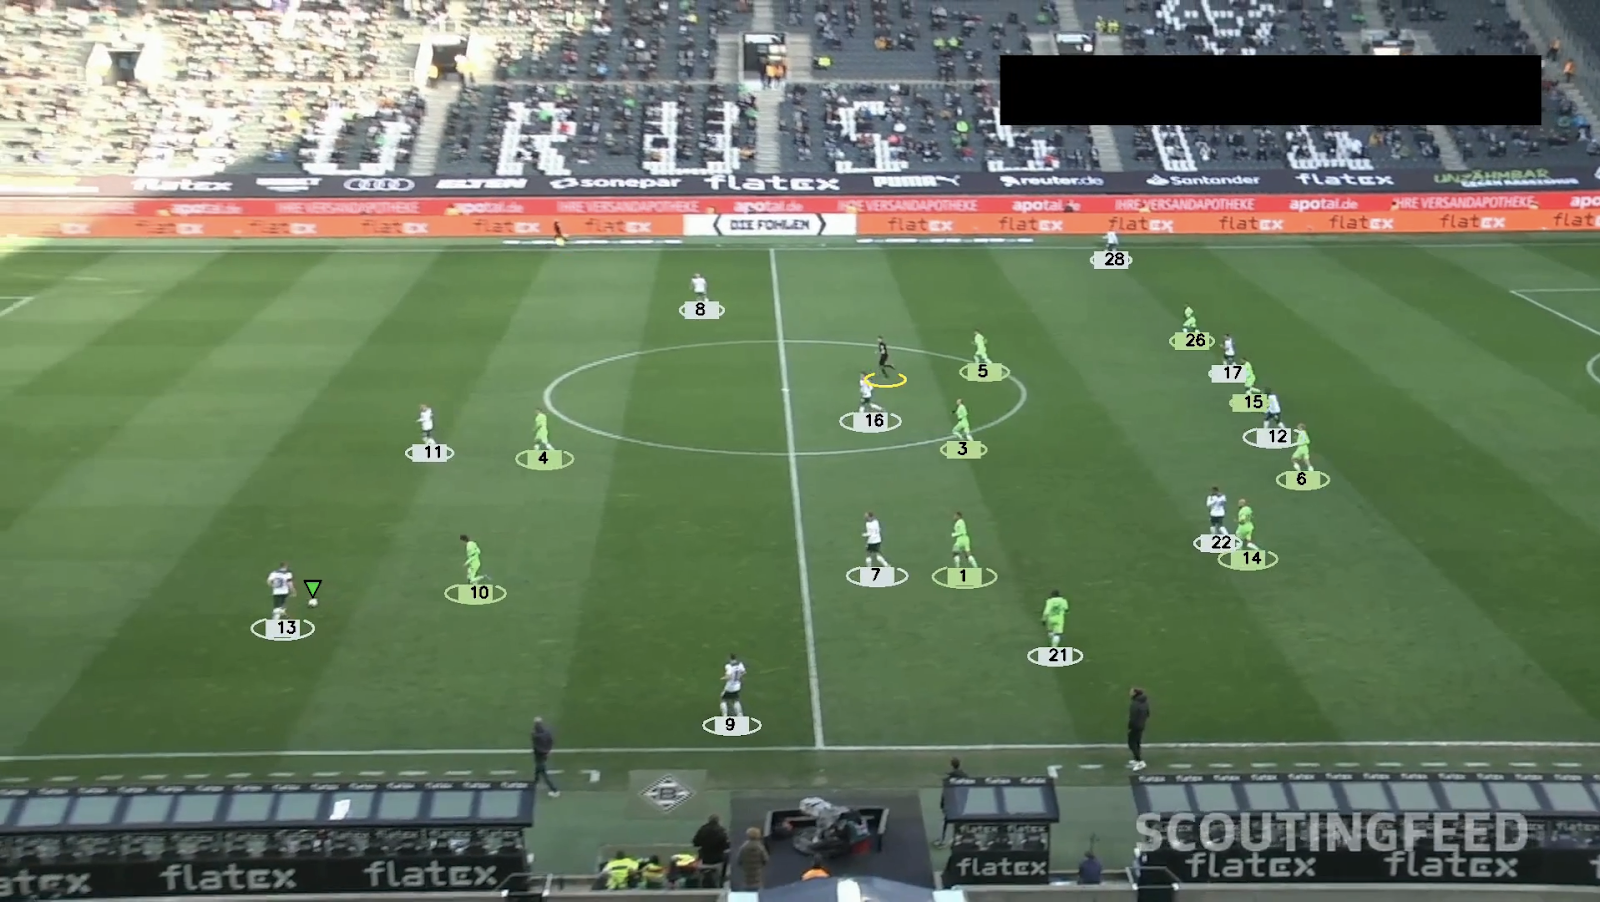
To address those issues, I changed the labels and bounding box representations to clear out visual noise and make the model easier to interpret. Only visual changes are made in the model in this step. The ball icon is also a green triangle. However, as seen in the picture, the ball is sometimes not detected.
Model with Team Colors
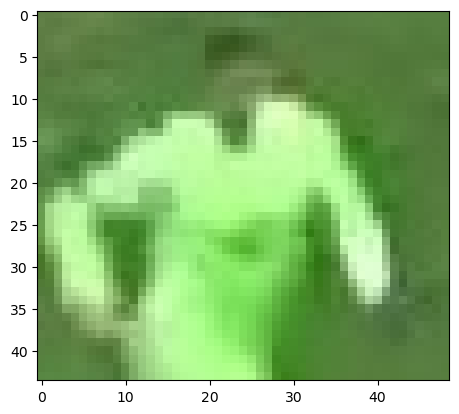
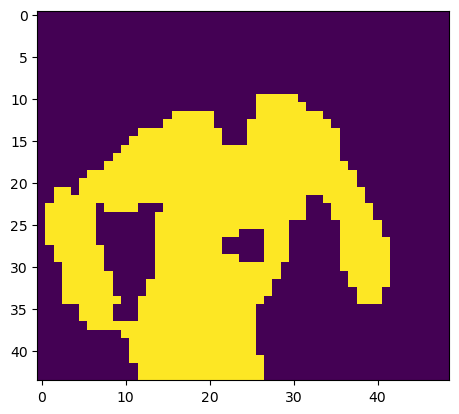
To add team colors to the model, I took the bounding box of each of the detected objects. I then took the top half of the bounding box – where the kit is located – and ran a K-Means model. I found the average RGB value of the two clusters and took the K-Means label of the 4 corners of the image to find the background label according to the K-Means model.
Top half of bounding box
2 Clusters K-Means model found
Model with Interpolated Ball
In this model, the issue with losing ball detection is solved. Because passes in soccer are linear or have a path, we can interpolate where the ball should be in the frames where the detection is lost. If we take the last frame where the ball is detected and the first frame where the ball is relocated, we can estimate the position of the ball based on the frames. This solves the issue of losing ball detection.
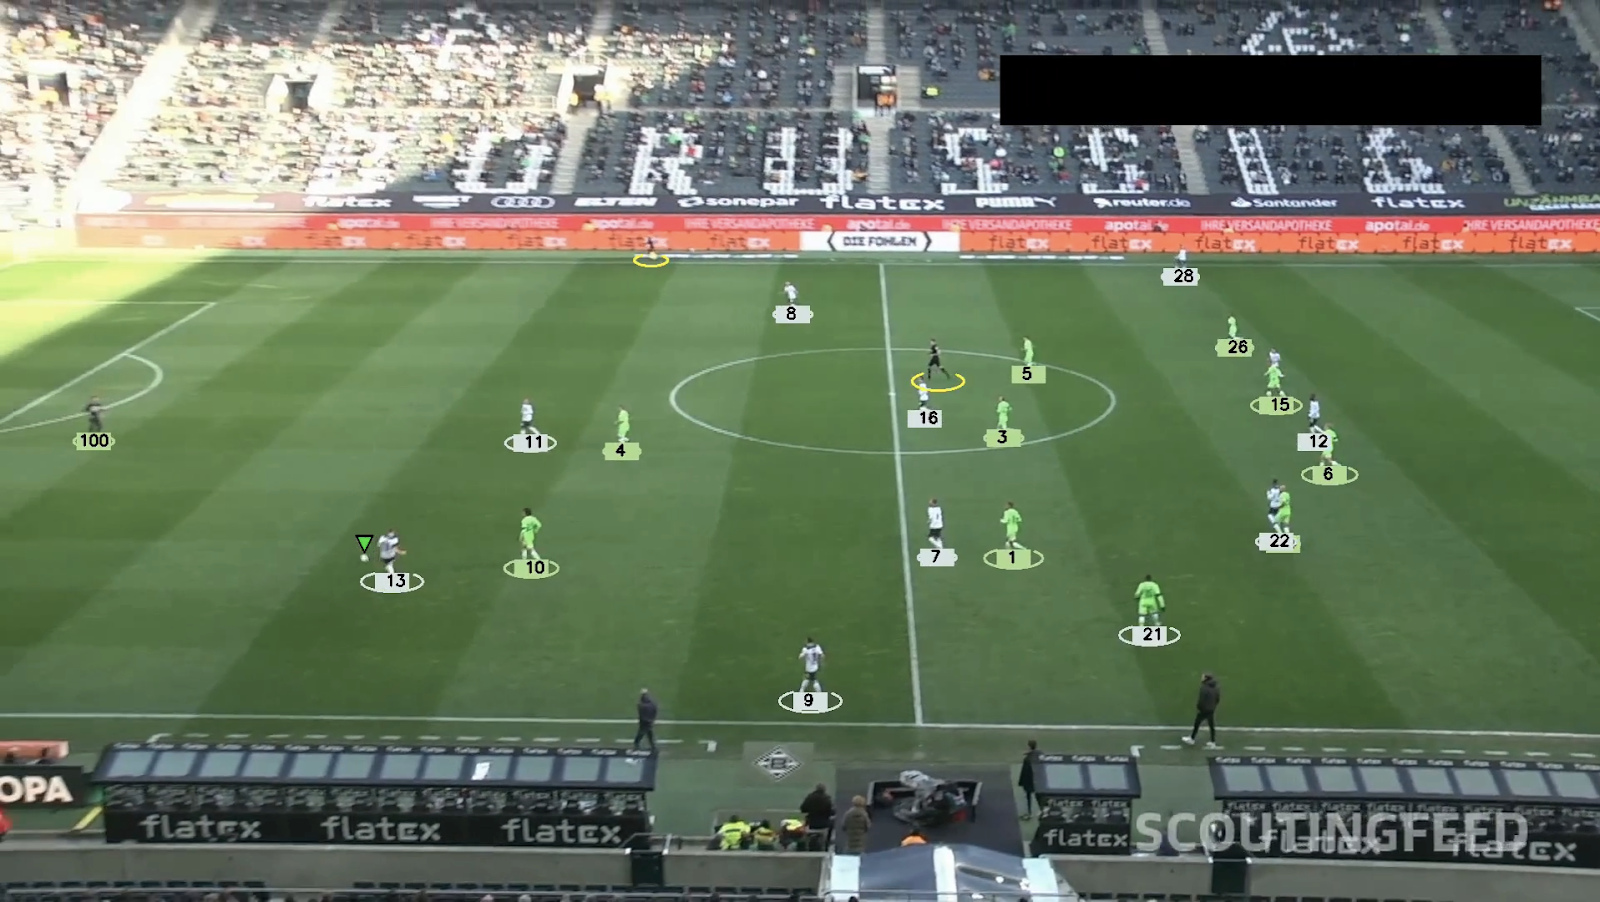
Model showing Ball Possession

I then added a red icon showing which player has possession of the ball. We are able to do this because we have the ball position and player position. If the ball is close enough to a player, we can say they have possession.
Model with Team Possession Statistic
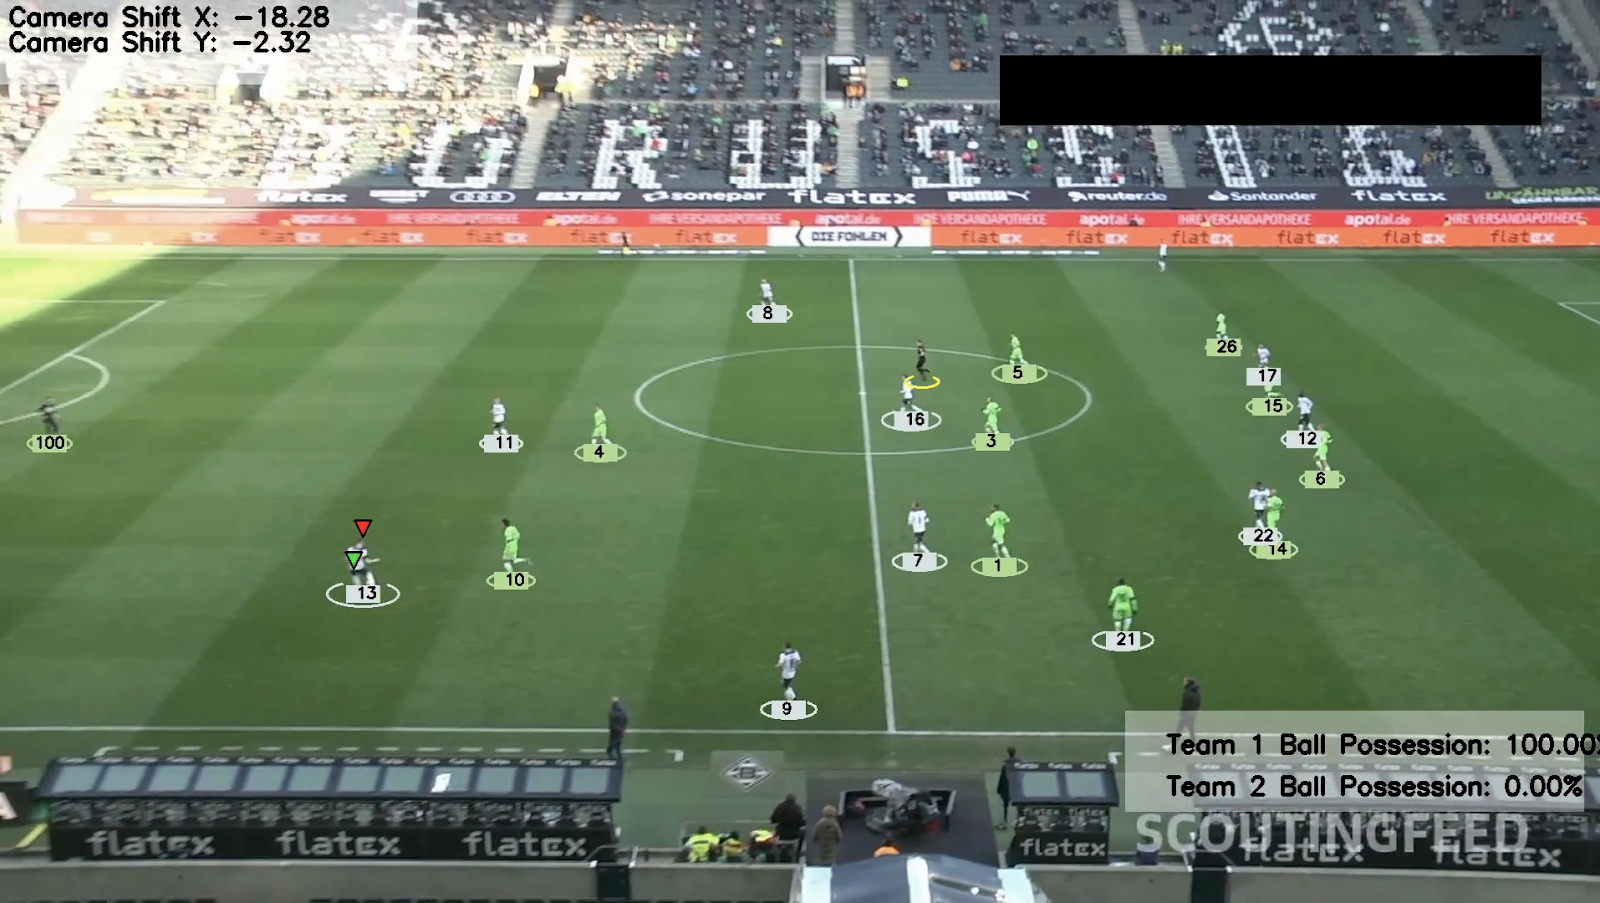
Because we have player possession and know which player is on which team, we can calculate the overall team possession in the clip. I added a statistics panel to the bottom right corner to show each team’s possession.
Model with Camera Shift and Position Adjusted
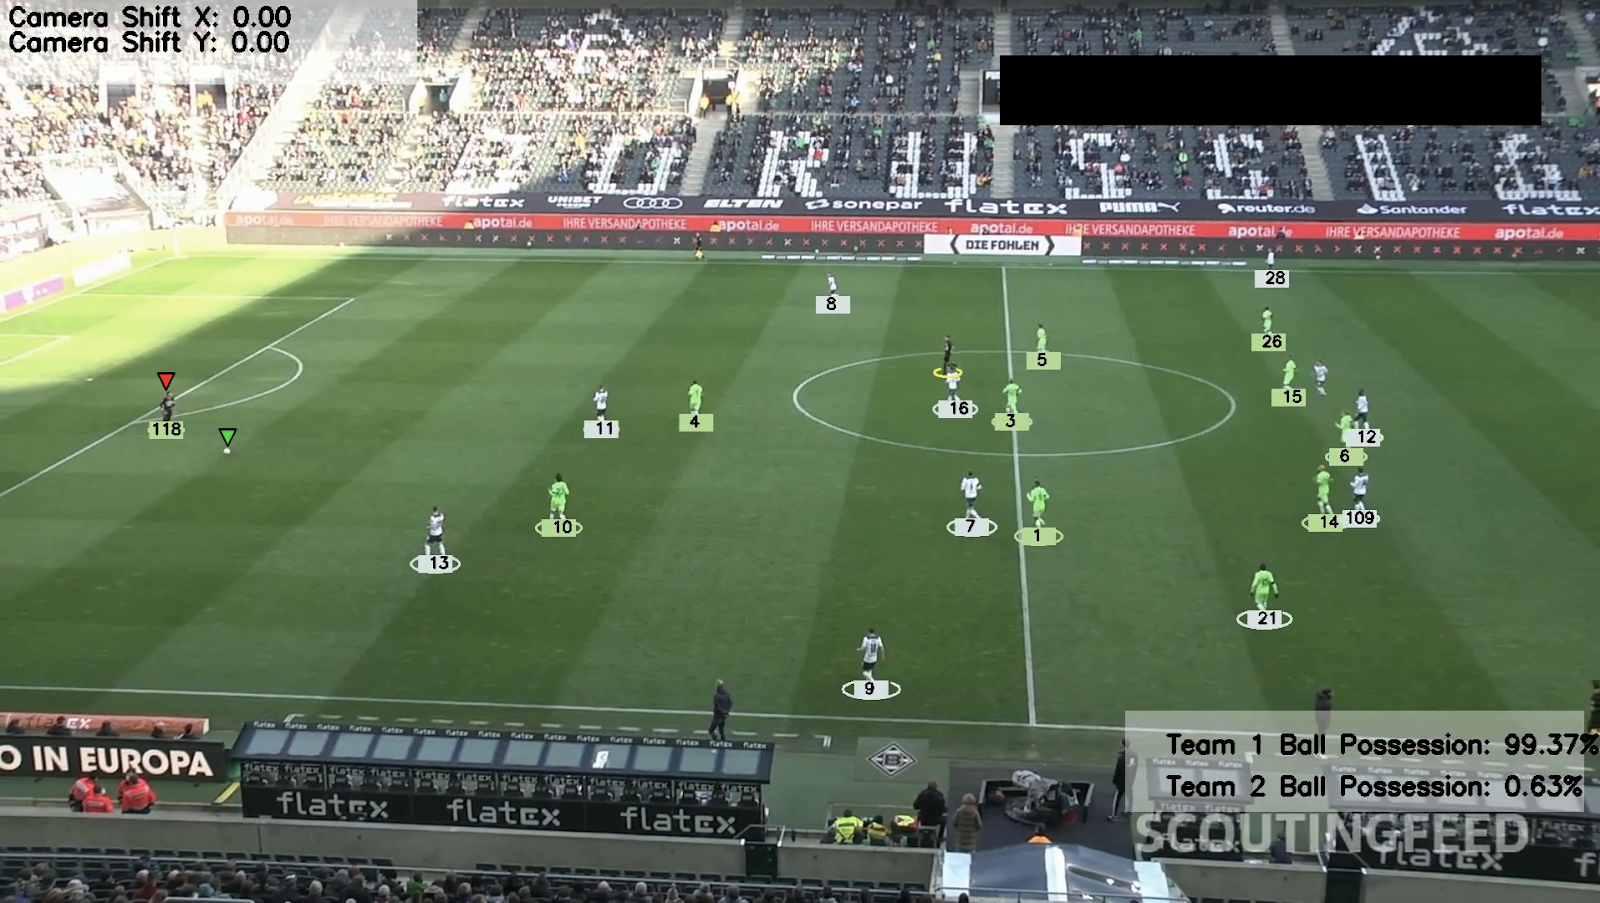
Due to the camera angle and shift, calculating player speed and distance traveled will need a transformation or scaling. This is seen because the number of pixels between player 3 on the green team and the top of the soccer pitch is not equal to the number of pixels between player 3 on the green team and the bottom of the soccer pitch. If we have a point of reference, we can adjust each player’s position accordingly. There is no visual change in this model output, but the positions of each of the bounding boxes are adjusted. Due to the camera shift, having points of reference is difficult, but we can track the adjusted positions for players in the middle third of the soccer field.
Model with Speed and Distance Calculations
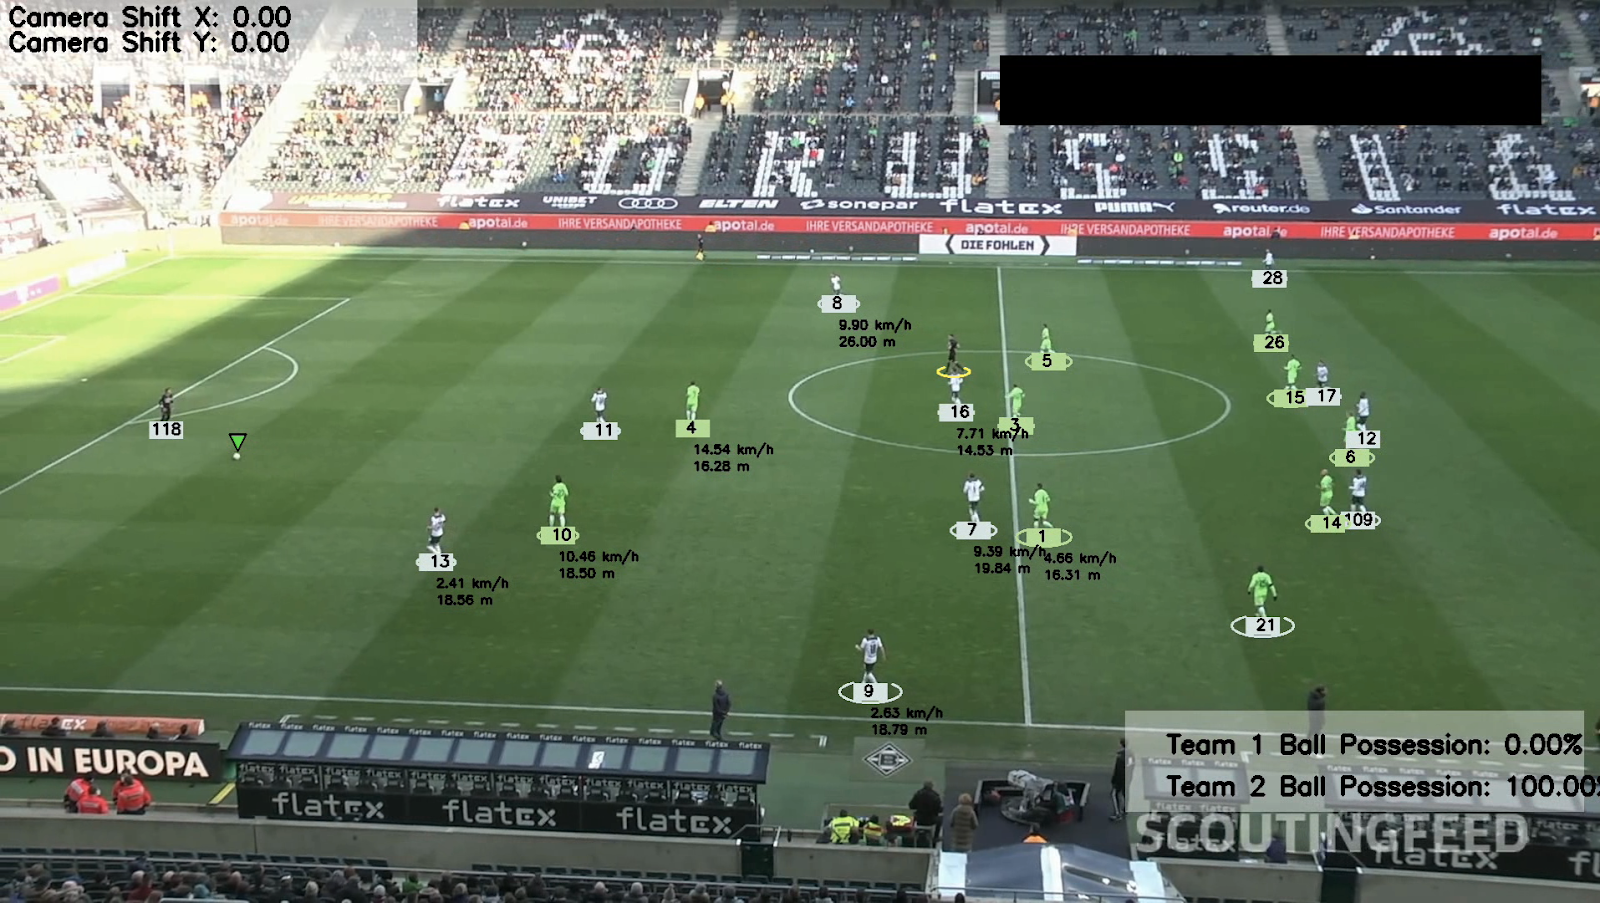
Now with the position adjusted, we can estimate the player’s speed and distance traveled. It is displayed under each player in the tracked region.
Further Works
To further improve this model. we can add matches to the training data. This would sharpen the model and may even solve the problem of losing ball detection with no added work. Interpolation of the ball and adjusted positions of the players may also be improved. A closer estimation can be found and used in the model.
Because we have individual players, we can also keep statistics on individual players. To further this project, the ability to track players throughout the season can be added, provided we have a universal library of all players in the league.
This model takes a raw soccer video as an input and outputs a soccer video with players, referees, and ball tracked with statistics. This can be expanded into other sports, as well, including basketball, tennis, football, baseball, rugby, cricket etc. There are many insights a program or model such as this may show a coach that were not seen before.