Machine Learning for Lotteries
Contributed by Stephen Penrice. He took NYC Data Science Academy 12 week full time Data Science Bootcamp program between Sept 23 to Dec 18, 2015. The post was based on his fourth class project(due at 8th week of the program).
Lucky Numbers Part 2: Machine Learning for Understanding Lottery Players' Preferences
Stephen Penrice
Introduction
In a quick unscientific poll at a recent NYC Data Science Academy meetup, most people indicated that they have played the lottery at one time or another, but of those who have played, only a few indicated that they choose their own numbers. But was my audience at the meetup a representative sample of lottery players? Probably not, given the quantitative skills one would assume for people who choose to spend an evening listening to data science presentations. The goal of this project is to understand the selection behavior of lottery players as a whole. In particular I want to answer the following questions:
- Are there certain number combinations that are selected unusually often by lottery players?
- In games where winners share a fixed pool of prize money (i.e. parimutuel games), are the expected prize amounts appreciably lower for players who choose popular combinations? In other words, are customers who loyally play “their” numbers getting smaller payouts than occasional players who play random numbers selected by the lottery terminal?
While data on player selections are not publicly available, all lotteries in the United States publish their winning numbers and the amount awarded for each prize level. In this project I looked at data from six different games.
- Florida Fantasy 5
- Pennsylvania Cash 5
- New Jersey Cash 5
- North Carolina Cash 5
- Texas Cash 5
- Oregon Megabucks
I encourage you to visit some of these sites and look at past winning numbers to get a feel for the variation in prize amounts. Since these are all parimutuel games, the variation in prizes corresponds to variation in the percentage of players who won. So either the Law of Large Numbers does not apply to lotteries, or there is a non-random aspect of player selection. I hope to convince you that the latter is true.
Here’s some quick background for readers who are not familiar with lotteries. In the games I studied, the lottery draws 5 or 6 distinct numbers from a set of about 40 integers, and the order in which the numbers are drawn has no effect on prize amounts. For example, New Jersey Cash 5 draws 5 numbers from 1 to 43. The set from which the numbers are selected is called a “matrix” (not to be confused with the mathematical object with the same name). The Cash 5 games have several hundred thousand possible outcomes, and the Oregon game has about 12 million outcomes. The odds of winning the prizes I discuss range from about 1 in 100 to 1 in 1,000. The target quantity for each model is the prize amount that the lottery will pay to each winner given a set of drawn numbers.
Analysis Organization and Infrastructure
The first challenge I faced in this project was keeping the various components organized and reasonably uniform. The need for organization arose in part from my plan to produce separate models not only for each game but also for different prize levels within the games (e.g. the prize for matching three numbers and the prize for matching four numbers for each “Cash 5” game.) Moreover, there are idiosyncracies in the data that are unrelated to player selections but that still affect the prize payouts:
- New Jersey expanded its “matrix” in September of 2014 and changed its prize money allocation accordingly. I had to limit my data set to draws for which the current prize scheme applies.
- In the Texas Cash 5, the prize for matching 4 numbers depends on whether any players won the prize for matching 5, because when no one wins the top prize the jackpot money is divided among the second prize winners rather than being carried over to the next draw’s jackpot. I created separate models for each of these cases.
- In Florida’s Fantasy 5 game, the second prizes are increased when there is no top prize winner and there is also a cap of $555 on the second prizes. Whenever there is no top prize winner and a parimutuel payout of the second prizes would be more than $555, the excess money is added to the third prize pool. I dealt with this simply by limiting my data to draws where there was a jackpot winner, which is the vast majority of cases.
This resulted in a total of 12 analyses.
- FL Fantasy 5, 3-match prize, draws with at least 1 jackpot winner
- FL Fantasy 5, 4-match prize, draws with at least 1 jackpot winner
- NJ Cash 5, 3-match prize
- NJ Cash 5, 4-match prize
- PA Cash 5, 3-match prize
- PA Cash 5, 4-match prize
- NC Cash 5, 3-match prize
- NC Cash 5, 4-match prize
- TX Cash 5, 3-match prize
- TX Cash 5, 4-match prize, no jackpot winner
- TX Cash 5, 4-match prize, at least one jackpot winner
- OR Megabucks, 4-match prize
My goal for handling the special considerations discussed above was to find a way to make a note of them in exactly one place and enable my analyses to reflect these idiosyncracies without ever explicitly coding them in R. My solution was to build a PostgreSQL database that holds both the raw data and the information that my R code needed to pull the correct data for each analysis. The structure is summarized in the following diagram:

The “Data” box in the upper portion of the diagram represents the tables holding the data I had scraped from the various lottery websites, with a table for each of the games. The “Games” box is a table that holds the key information for each game: how many numbers are selected, the size of the matrix, the earliest drawing date that should be should be included in the analyses, and the name of the table that holds the data for that game. The “Analyses” box represents a table that contains the necessary information about each analysis: the id for the game in the previous table, the prize that is being analyzed, and any filters that need to be included when querying the data tables. This structure enables R to retrieve the data it needs for a given analysis by using just the id from the analysis table, and after pulling the data it is ready to calculate features for each draw.
I kept a uniform feature structure across all games and analyses. In order to discuss these features generally, let’s say we’re drawing  distinct numbers from the set
  . The most basic features are the numbers selected,
  ,
,  , …,
, …,  , where
  . I also derived various features from these numbers. In order to have a summary of the magnitudes of the numbers drawn, I calculated the sum
  . I also wanted to model the possibility that players choose numbers from a small range, so I included
  , the difference between the largest and smallest numbers drawn. In order to test the effect of evenly spaced numbers, I used the standard deviation of the gaps between consecutive numbers, i.e. the standard deviation of
  . Finally, in order to capture aspects of the numbers that are related to players’ preferences, superstitions, etc. I included flags
  where
where  if
if  was drawn and 0 otherwise.
The other potential source of complication in this project was the variety of machine learning models I wanted to apply to all of my analyses:
- regression
- elastic net
- k nearest neighbors
- random forests
- boosting applied to random forests with trees of depth up to 3
Fortunately, the R package “caret” (“classification and regression training”) uses standrdized functions to make it easy to tune and train a variety of models.
Once I had everything standardized, training the models was straightforward. I cut off the data at July 31, 2015 so that I would have a set of recent data that had been untouched by any training, validation, or model selection processes. I split the training/test sets in 75/25 proportions and used root mean squared error on the test set as the criterion for final model selection. I used 5-fold cross-validation to tune the models, and I generally used caret’s default grids for the possible tuning parameters.
Now let’s look at the results of the best models to emerge from this process.
Model Performance
Here are the summaries of the models’ performance for draws since August 1, 2015 on. (Remember, these draws were not used to train or select the models.) For the analyses that looked at the 3-match prizes, I rounded the predictions to the the nearest $1.00 or $0.50 (depending on the granularity of the game’s actual prizes) and reported the results in a confusion matrix. I also show the Mean Absolute Percent Error, or MAPE. The errors are consistently around 5% of the actual values.
## fl_fantasy_5 prize3
## MAPE: 0.0361
## actual
## predict 7 8 8.5 9 9.5 10 10.5 11 11.5 12 12.5
## 7 1 0 0 0 0 0 0 0 0 0 0
## 8 0 1 1 0 0 0 0 0 0 0 0
## 8.5 0 2 5 1 0 0 0 0 0 0 0
## 9 0 0 1 3 4 0 0 0 0 0 0
## 9.5 0 0 0 3 2 1 0 0 0 0 0
## 10 0 0 1 1 3 5 3 0 0 0 0
## 10.5 0 0 0 0 0 5 4 0 0 0 0
## 11 0 0 0 0 0 2 4 2 4 0 0
## 11.5 0 0 0 0 0 0 0 1 0 5 0
## 12 0 0 0 0 0 0 0 0 0 1 1## nj_cash_5 prize3
## MAPE: 0.0526## actual
## predict 9 10 11 12 13 14 15 16 17 18 19 20
## 10 2 0 1 0 0 0 0 0 0 0 0 0
## 11 0 2 3 0 0 0 0 0 0 0 0 0
## 12 0 1 1 3 4 1 0 0 0 0 0 0
## 13 0 0 0 0 3 1 1 0 0 0 0 0
## 14 0 0 0 0 2 5 2 1 0 0 0 0
## 15 0 0 0 0 0 7 6 4 0 0 0 0
## 16 0 0 0 0 0 0 4 5 2 0 0 0
## 17 0 0 0 0 0 0 0 2 5 3 1 0
## 18 0 0 0 0 0 0 0 1 6 1 1 1
## 19 0 0 0 0 0 0 0 0 1 2 2 1
## 20 0 0 0 0 0 0 0 1 0 2 1 0## pa_cash_5 prize3
## MAPE: 0.0419## actual
## predict 6.5 7 7.5 8 8.5 9 9.5 10 10.5 11 11.5 12 12.5 13 13.5 14 14.5 15
## 8 1 1 3 1 0 0 0 0 0 0 0 0 0 0 0 0 0 0
## 8.5 0 0 0 0 2 1 0 0 0 0 0 0 0 0 0 0 0 0
## 9 0 0 0 1 0 0 0 1 0 0 0 0 0 0 0 0 0 0
## 9.5 0 0 0 0 0 1 1 0 0 0 0 0 0 0 0 0 0 0
## 10 0 0 0 0 0 1 5 6 0 0 0 0 0 0 0 0 0 0
## 10.5 0 0 0 0 0 0 1 2 8 3 0 0 0 0 0 0 0 0
## 11 0 0 0 0 0 0 0 0 0 1 0 0 0 0 0 0 0 0
## 11.5 0 0 0 0 0 0 0 0 1 1 6 3 0 0 0 0 0 0
## 12 0 0 0 0 0 0 0 0 0 0 2 4 2 0 0 0 0 0
## 12.5 0 0 0 0 0 0 0 0 0 0 1 1 1 3 0 0 0 0
## 13 0 0 0 0 0 0 0 0 0 0 0 2 1 1 1 1 0 0
## 13.5 0 0 0 0 0 0 0 0 0 0 0 0 0 2 0 1 3 0
## 14 0 0 0 0 0 0 0 0 0 0 0 0 0 0 2 2 0 0
## 14.5 0 0 0 0 0 0 0 0 0 0 0 0 0 2 0 0 0 0
## 15 0 0 0 0 0 0 0 0 0 0 0 0 0 0 1 0 2 1
## actual
## predict 15.5 16 16.5 17
## 8 0 0 0 0
## 8.5 0 0 0 0
## 9 0 0 0 0
## 9.5 0 0 0 0
## 10 0 0 0 0
## 10.5 0 0 0 0
## 11 0 0 0 0
## 11.5 0 0 0 0
## 12 0 0 0 0
## 12.5 0 0 0 0
## 13 0 0 0 0
## 13.5 0 0 0 0
## 14 0 0 0 0
## 14.5 1 1 0 0
## 15 0 1 1 1## nc_cash_5 prize3
## MAPE: 0.0235## actual
## predict 3 4 5 6 7
## 3 2 1 0 0 0
## 4 1 24 2 0 0
## 5 0 3 49 1 0
## 6 0 0 0 3 1## tx_cash_5 prize3
## MAPE: 0.0515## actual
## predict 7 8 9 10 11 12 13
## 7 2 0 0 0 0 0 0
## 8 0 1 1 0 0 0 0
## 9 0 4 8 3 0 0 0
## 10 0 0 4 9 3 0 0
## 11 0 0 1 9 17 9 2
## 12 0 0 0 0 2 3 1For the 4-match analyses, I made scatterplots rather than confusion matrices. The percent errors tend to be in the 10% to 15% range. I believe the lower accuracy is due to the fact that there are fewer winners in these cases so the prize amounts are more influenced by random variation.
## fl_fantasy_5 prize4
## MAPE: 0.0865


## nj_cash_5 prize4
## MAPE: 0.1264


## pa_cash_5 prize4
## MAPE: 0.1237


## nc_cash_5 prize4
## MAPE: 0.1487


## tx_cash_5 prize4
## MAPE: 0.1393


## tx_cash_5 prize4
## MAPE: 0.1596


## or_megabucks prize4
## MAPE: 0.0605


Applying the Models
These are accurate models, but they have one shortcoming: THEY DON’T ANSWER OUR QUESTIONS!!! They simply answer the question, “For a given combination that has been drawn, what is the predicted prize amount that the lottery will pay to the winners?” One could argue that the models say something about which combinations are most popular, because low prize payouts correspond to popular combinations. But they aren’t much help in understanding our second question: how much of an impact is there on a given selection’s expected prize? For example, if we want to know the expected 3-match prize for the selection  , we have to apply the relevant model to
  and to
  and to
  and to several thousand other possible draws that match in 3 places. It is possible that when we average over all winning combinations, there is not much difference in the expected prize amount. So we need to do multiple applications of the models, and we need to do so efficiently.
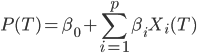
More formally, given a model  for estimating the expected prize for
  matches, the following expression gives the expected prize amount for a given selection
  :
:
where
In general,  is large:
  when the game selects numbers from
  . For example, in the 3-match analysis of New Jersey Cash 5
  . Since the are
  selections to evaluate (962,598 in the New Jersey example), we need to make the model calculations as efficient as possible. One tactic is to precompute the model on all combinations and simply look up these values when evaluating
  . And the list of precomputed values will be most efficient if it is in lexicographic order, because then there is a fast algorithm for finding the position of a given value
  on the list using just the elements of
  .
.
Unfortunately, I found that even with these efficiencies, it takes about 0.8 second to calculate for a single selection . At this rate it would take 8 to 9 days to evaluate all the expected 3-match prizes for New Jersey Cash 5, and that’s just one of my twelve analyses! So I needed to find a faster implementation.
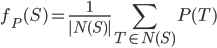
I was willing to sacrifice some accuracy in order to speed up the calculations of , and it occurred to me that using a linear function might be helpful. If has the form

 is the average of
  over all in . This will not necessarily speed up the calculations, because we still need to average
  over all of . But it does help when we do a regression on the flags
  . If
. If
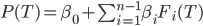
then
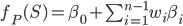
where

which can be evaluated very quickly: all 12 of my analyses ran in about one hour. (See the Appendix for a proof that  .)
.)
So we are finally in a position to find the selections for each game that have the 10 lowest expected prize amounts. Here are the results for each 3-match analysis.
FL Fantasy 5:
##       n1 n2 n3 n4 n5 avgprize
##  [1,]  3  5  7  9 11 7.943926
##  [2,]  5  7  9 10 11 7.955978
##  [3,]  3  7  9 10 11 7.962647
##  [4,]  5  7  8  9 11 7.963678
##  [5,]  3  7  8  9 11 7.970347
##  [6,]  5  7  9 11 12 7.973561
##  [7,]  3  7  9 11 12 7.980230
##  [8,]  7  8  9 10 11 7.982399
##  [9,]  7  9 10 11 12 7.992283
## [10,]  7  8  9 11 12 7.999983
New Jersey Cash 5:
##       n1 n2 n3 n4 n5 avgprize
##  [1,]  3  5  7  8 12 10.96077
##  [2,]  3  5  7  9 12 10.98105
##  [3,]  3  5  7  8  9 10.99249
##  [4,]  5  7  8  9 12 10.99942
##  [5,]  3  7  8  9 12 11.02162
##  [6,]  3  5  7 11 12 11.02523
##  [7,]  3  5  7  8 11 11.03667
##  [8,]  5  7  8 11 12 11.04359
##  [9,]  3  5  7  9 11 11.05695
## [10,]  5  7  9 11 12 11.06387
Pennsylvania Cash 5:
##       n1 n2 n3 n4 n5 avgprize
##  [1,]  5  7  9 11 12 7.803290
##  [2,]  3  5  7 11 12 7.818146
##  [3,]  5  7  8 11 12 7.830267
##  [4,]  5  7 10 11 12 7.862501
##  [5,]  3  5  7  9 11 7.866244
##  [6,]  5  7  8  9 11 7.878364
##  [7,]  3  5  7  8 11 7.893220
##  [8,]  5  7  9 10 11 7.910598
##  [9,]  3  5  7 10 11 7.925455
## [10,]  3  5  7  9 12 7.937129
North Carolina Cash 5:
##       n1 n2 n3 n4 n5 avgprize
##  [1,]  5  7  8  9 11 3.576551
##  [2,]  3  5  7  9 11 3.589897
##  [3,]  3  7  8  9 11 3.600528
##  [4,]  3  5  7  8 11 3.611937
##  [5,]  5  7  9 11 12 3.612730
##  [6,]  7  8  9 11 12 3.623360
##  [7,]  5  7  8 11 12 3.634770
##  [8,]  3  7  9 11 12 3.636706
##  [9,]  3  5  8  9 11 3.638946
## [10,]  5  7  9 10 11 3.641547
Texas Cash 5:
##       n1 n2 n3 n4 n5 avgprize
##  [1,]  3  5  7  9 11 7.859660
##  [2,]  5  7  8  9 11 7.879023
##  [3,]  5  7  9 10 11 7.889834
##  [4,]  3  7  8  9 11 7.904373
##  [5,]  3  7  9 10 11 7.915184
##  [6,]  3  5  7  8  9 7.920539
##  [7,]  3  5  7  8 11 7.926993
##  [8,]  5  7  9 11 12 7.929643
##  [9,]  3  5  7  9 10 7.931350
## [10,]  7  8  9 10 11 7.934547
The level of agreement across the different data sets is truly remarkable. The numbers are low, all less than 12, but 2, 4, and 6 do not appear on any of the lists. Meanwhile, 7 and 11 appear in almost every combination.
There is still the question of how much players are disadvantaged when they choose these popular combinations. To quantify this, we can look at the smallest expected prizes (already shown above), the average expected prize, and the largest expected prize. Here are the results for the 3-match analyses.
##           Game Minimum Average Maximum
## 1 FL Fantasy 5    7.94    9.97   12.27
## 2    NJ Cash 5   10.96   15.08   21.55
## 3    PA Cash 5    7.80   11.55   16.55
## 4    NC Cash 5    3.58    4.66    5.96
## 5    TX Cash 5    7.86   10.14   12.67
We should also scale these numbers to the probability of winning a 3-match prize. This also allows for an apples-to-apples comparison across games and puts the differences on the same scale as the expected prize payout, typically about $0.50.
##           Game Minimum Average Maximum
## 1 FL Fantasy 5  0.0979  0.1230  0.1513
## 2    NJ Cash 5  0.0800  0.1101  0.1574
## 3    PA Cash 5  0.0570  0.0844  0.1209
## 4    NC Cash 5  0.0349  0.0454  0.0581
## 5    TX Cash 5  0.0894  0.1154  0.1442
So we can see that the difference in expected payouts between the most and least popular selections is often around 10% of the total expected prize payout, and this is not even considering the 4-match prizes, or the fact that players who hit the jackpot with a popular combination have a high likelihood of having to share that prize. Whether it was a conscious design choice or not, it would seem parimutuel lotteries give greater reinforcement to their casual players, i.e. the one who don’t select their own numbers.
Take-aways
Aside from the insights into the lottery, I think there are a few data science lessons to be learned here:
- Sometimes data that directly addresses your questions is not available, so you need to look for data that speaks to a related question.
- If you do end up using data in an indirect manner, keep the original question in mind and remember to transform your results back to the original context.
- If your most accurate models can’t be implemented in a way that answers your question, try a less accurate model that can.
Appendix
To prove that , we need to show two things:
- If  then
then  of the sets in contain
- If  then
then  of the sets in contain
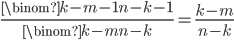
Any set in consists of an -element subset of and a  -element subset of
  . In the case where we only need to find the fraction of -element subsets of that contain . There are
  such sets because that is the number of ways we can choose the elements other than . So the fraction that contain is
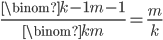
Similarly, in the case where we only need to find the fraction of -element subsets of  that contain . There are
  such sets because that is the number of ways we can choose the elements other than . So the fraction that contain is