NYC Data Science Academy| Blog
Bootcamps
Lifetime Job Support Available Financing Available
Bootcamps
Data Science with Machine Learning Flagship ๐Ÿ† Data Analytics Bootcamp Artificial Intelligence Bootcamp New Release ๐ŸŽ‰
Free Lesson
Intro to Data Science New Release ๐ŸŽ‰
Find Inspiration
Find Alumni with Similar Background
Job Outlook
Occupational Outlook Graduate Outcomes Must See ๐Ÿ”ฅ
Alumni
Success Stories Testimonials Alumni Directory Alumni Exclusive Study Program
Courses
View Bundled Courses
Financing Available
Bootcamp Prep Popular ๐Ÿ”ฅ Data Science Mastery Data Science Launchpad with Python View AI Courses Generative AI for Everyone New ๐ŸŽ‰ Generative AI for Finance New ๐ŸŽ‰ Generative AI for Marketing New ๐ŸŽ‰
Bundle Up
Learn More and Save More
Combination of data science courses.
View Data Science Courses
Beginner
Introductory Python
Intermediate
Data Science Python: Data Analysis and Visualization Popular ๐Ÿ”ฅ Data Science R: Data Analysis and Visualization
Advanced
Data Science Python: Machine Learning Popular ๐Ÿ”ฅ Data Science R: Machine Learning Designing and Implementing Production MLOps New ๐ŸŽ‰ Natural Language Processing for Production (NLP) New ๐ŸŽ‰
Find Inspiration
Get Course Recommendation Must Try ๐Ÿ’Ž An Ultimate Guide to Become a Data Scientist
For Companies
For Companies
Corporate Offerings Hiring Partners Candidate Portfolio Hire Our Graduates
Students Work
Students Work
All Posts Capstone Data Visualization Machine Learning Python Projects R Projects
Tutorials
About
About
About Us Accreditation Contact Us Join Us FAQ Webinars Subscription An Ultimate Guide to
Become a Data Scientist
    Login
NYC Data Science Acedemy
Bootcamps
Courses
Students Work
About
Bootcamps
Bootcamps
Data Science with Machine Learning Flagship
Data Analytics Bootcamp
Artificial Intelligence Bootcamp New Release ๐ŸŽ‰
Free Lessons
Intro to Data Science New Release ๐ŸŽ‰
Find Inspiration
Find Alumni with Similar Background
Job Outlook
Occupational Outlook
Graduate Outcomes Must See ๐Ÿ”ฅ
Alumni
Success Stories
Testimonials
Alumni Directory
Alumni Exclusive Study Program
Courses
Bundles
financing available
View All Bundles
Bootcamp Prep
Data Science Mastery
Data Science Launchpad with Python NEW!
View AI Courses
Generative AI for Everyone
Generative AI for Finance
Generative AI for Marketing
View Data Science Courses
View All Professional Development Courses
Beginner
Introductory Python
Intermediate
Python: Data Analysis and Visualization
R: Data Analysis and Visualization
Advanced
Python: Machine Learning
R: Machine Learning
Designing and Implementing Production MLOps
Natural Language Processing for Production (NLP)
For Companies
Corporate Offerings
Hiring Partners
Candidate Portfolio
Hire Our Graduates
Students Work
All Posts
Capstone
Data Visualization
Machine Learning
Python Projects
R Projects
About
Accreditation
About Us
Contact Us
Join Us
FAQ
Webinars
Subscription
An Ultimate Guide to Become a Data Scientist
Tutorials
Data Analytics
  • Learn Pandas
  • Learn NumPy
  • Learn SciPy
  • Learn Matplotlib
Machine Learning
  • Boosting
  • Random Forest
  • Linear Regression
  • Decision Tree
  • PCA
Interview by Companies
  • JPMC
  • Google
  • Facebook
Artificial Intelligence
  • Learn Generative AI
  • Learn ChatGPT-3.5
  • Learn ChatGPT-4
  • Learn Google Bard
Coding
  • Learn Python
  • Learn SQL
  • Learn MySQL
  • Learn NoSQL
  • Learn PySpark
  • Learn PyTorch
Interview Questions
  • Python Hard
  • R Easy
  • R Hard
  • SQL Easy
  • SQL Hard
  • Python Easy
Data Science Blog > Machine Learning > Ames Iowa Housing Prices Model

Ames Iowa Housing Prices Model

Ethan Zien, David Wasserman, Liam McDermott and Jan Ruffner
Posted on Mar 26, 2021

The skills the author demoed here can be learned through taking Data Science with Machine Learning bootcamp with NYC Data Science Academy.

Objective

Our goal was to construct the most accurate possible model to predict housing prices in Ames, IA.

Background on Ames

While Ames embodies the typical college town in the Midwest, it also represents a unique combination of demographics and history. Ames has the distinction of being the only city with a population of more than 65,000 where 45% of residents are enrolled in college or graduate school. This has a distorting effect on income demographics where the median household income is $46,000 and the 28% poverty rate is nearly 3 times the national average.

The housing market prices are considerably different on the basis of median price per square foot on a neighborhood basis. The highest priced neighborhood is the Green Hill section with an average $198.65 per square foot, while the Southwest of ISU neighborhood rounds out the bottom at $89.89 per square foot.

The real estate market often utilizes price per square foot as a defining metric and โ€œlocation, location, locationโ€ as a mantra. Intuitively, it would seem that basing the dependent variable on these characteristics would yield the most accurate results. In practice, the results were less accurate than using Total Living Area and Neighborhood as features and โ€œsale priceโ€ as the dependent variable. 

As the boxplot below illustrates, the median price per square foot is around $125 per foot. Using price per square foot, variance of the target variable is reduced, leading to a reduction in R Squared.

Ames Iowa Housing Prices Model

Feature Analysis and Selection - Pt. 1

In order to prepare the dataset for analysis, we cleaned the data. Duplicate records were removed. For the qualitative, categorical variables, we imputed all โ€œNAโ€ values with โ€œNone.โ€ For numerical, continuous features that had missing values, we substituted the value of zero with the exception of the year the garage was built. In that case, we left the value as N/A since we did not use the feature.

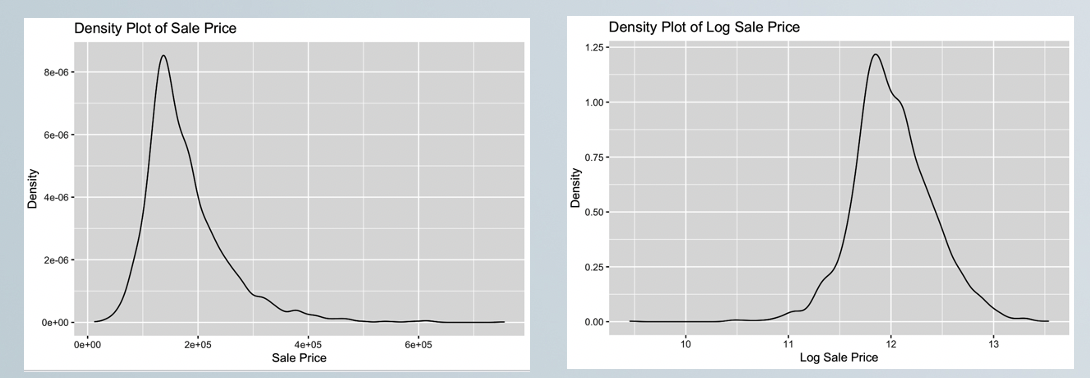
Once we investigated and cleaned the data, we began the process of determining what variables would be included in the final model. The first thing we looked into was how we wanted to view the dependent variable (sale price). We quickly realized that the best way to view was using the log of the sale price as opposed to the raw number. The reasoning for this is that the log of the sale price provided a more normal distribution of values.

Ames Iowa Housing Prices Model

Feature Analysis and Selection - Pt. 2

Next, we looked into variable creation for any variables that would be helpful to add to the data set. We wound up creating a handful of variables to help model the data.


Feature

Code Name

Calculation

Total Living Area

TotalLivingArea

GrLivArea + TotalBsmttSF - BsmtUnSF

Unused Lot Size

UnusedLotSize

LotArea - 1stFlrSF

Has Pool

HasPool

PoolArea > 0

Has Basement

HasBsmt

BsmtQual != None

Toilets

Toilets

HalfBath + FullBath + BsmtHalfBath + BsmtFullBath

Showers

Showers

FullBath + BsmtFullBath

House Age

HouseAge

max(YearBuilt) - YearBuilt + 1

House Age Squared

HouseAgeSq

HouseAge ^ 2

Up/Down Ratio

UpDownRatio

2ndFlrSF / 1stFlrSF


Variables such as Total Living Area and Unused Lot Size were created by aggregating existing variables in the dataset because we felt the aggregated values would paint a better picture than the individual values. Has Pool and Has Basement were created because there was value in whether or not the item existed, though the actual size wasnโ€™t particularly relevant.

Feature Analysis and Selection - Pt. 3

Once the necessary variables were added to the data set, we looked into the correlation across metrics to try and identify possible multicollinearity before beginning to model.

Ames Iowa Housing Prices Model

We also looked into how the individual metrics correlated with sale price.

Ames Iowa Housing Prices Model

Ames Iowa Housing Prices Model

Once we completed this process, we selected our variables for the initial modeling

Ames Iowa Housing Prices Model

Modeling the Prices of Houses in Ames

After selecting the overall features, they were separated into continuous, numeric and discrete, categorical variables. The categorical variables were โ€œdummifiedโ€ into a series of columns in which each column stood for a different value of the category. For instance, each neighborhood was represented by a column. All except one column would have zeros as values; the one column that represented the value of the feature would have a one as the value. This approach is known as One Hot Encoding.


The next step was to divide the features and targets into a training set (80% of the data) and a test set (the remaining 20%). The training set was used to fit the model while the test set was put aside to ensure that we did not overfit. 


Once the data was prepared, the following models were tested:


  1. Linear Regression
  2. Random Forest
  3. XGBoost
  4. LightGBM
  5. CatBoost
  6. Support Vector Machine

Linear Regression

In order to decrease multicollinearity and arrive at the most pertinent variables, Lasso regression was applied to the data set after scaling the variables. A grid search was performed on a variety of alpha penalization rates until we achieved a maximized test score where alpha equalled 4.6 x 10⁻⁵. 

This resulted in the following coefficients:

Since the regression model predicted the log of the sale price, we can interpret the coefficients to mean that  an increase in one unit of a given variable increases the log of the sale price by that coefficient (as long as all other variables are kept constant). For example, an increase of an additional square foot of Total Living Area would increase the log price by 2/100th of a cent. 

Boosting Models for Ames House Price Data

Boosting models are high-performing tree-based models. These models combine decision tree algorithms with boosting methods that train weak learners sequentially rather than in parallel like a Random Forest. Each subsequent tree in the boosting model attempts to correct the error of its predecessors.


Three variants of the boosting algorithm were tried:

  1. CatBoost
  2. LightGBM
  3. XGBoost


Each took a significant period of time to cross-validate the hyperparameters, so training was slow in general. What these models lacked in training speed, they more than made up for it in accuracy.


Depending on the model, different hyperparameters were tuned accordingly. Common among all of these were learning rate and maximum depth. CatBoost also offered a hyperparameter for L2 leaf regression. From our cross-validation, we learned that our best CatBoost model came from having a maximum depth of 7, an L2 Leaf Regularization parameter of 1, and a learning rate of 0.03.

Cross-Model Comparison

The following table details the best version of each model. From the table, we see that the boosting models tend to overfit, but the testing scores still outperform the other models.

Model

Training R2

Testing R2

Best RMSE

CatBoost

94.65%

91.62%

0.113

LightGBM

97.40%

91.00%

0.117

XGBoost

99.35%

90.89%

0.118

Random Forest

97.86%

89.66%

0.126

Support Vector Machine

90.38%

88.30%

0.134

Linear Regression

87.00%

88.24%

0.138

Conclusion


Among the estimated models, the best performing model is the CatBoost model. It explains around 92% of the variance in the dependent variable log sales price (Root mean squared error: 0.1135). As mentioned previously the model was estimated on a train data set and finally applied on a test data set. It is therefore an out of sample estimation.

Based on the variable importance plot the most important feature is the overall quality followed by the total living area. These two features capture 30 percent and 27 percent of the explained variance.


Variable Importance Plot

Feature

Importance

Overall Quality (OverallQual)

31%

Total Living Area (TotalLivingArea)

27%

House Age Squared (HouseAgeSq)

9%

Garage Area (GarageArea)

7%

Neighborhood (Neighborhood)

6%

Overall Condition (OverallCond)

5%

Unused Lot Size (UnusedLotSize)

4%

# of Toilets (Toilets)

4%

Basement Quality (BsmtQual)

3%

Sale Condition (SaleCondition)

2%

Building Type (BidgType)

1%

Lot Frontage (LotFrontage)

1%

Upstairs/Downstairs Ratio (UpDownRatio)

1%


A downside of the model is that we cannot directly interpret the effects of the explanatory variables on the log sales price. This is a common disadvantage of this type of blackbox model where a direct interpretation is not possible. We can, therefore, not make a claim about how much the price will increase when the overall quality is improved or when there is an additional bathroom. Despite this disadvantage, the model still provides a good guideline for what an investor should consider when buying a house. An investor should definitely look at the mentioned features such as the overall quality of a house or the age.  


A nice advantage of our analysis is that we can make a direct prediction of a house's price as long as we have the considered explanatory variables from our model. Letโ€™s assume we have a house with Overall Quality of 6, a total living area 330 square feet, a house age of 10 years; our model predicts a sale price of $420,000 USD. This can be compared to the offered price of a house with the same features for example on a web page such as Zillow. The comparison of our estimation and the offered price gives an investor a clear guideline if he should invest. An investor should invest if the offered price is lower in comparison to our estimated price.


About Authors

Ethan Zien

Data Analyst with a background in Social Media Advertising and a strong interest in sports analytics
View all posts by Ethan Zien >

David Wasserman

Data science professional with a background in finance and credit risk. Has the rare combination of technical skills and business acumen.
View all posts by David Wasserman >

Liam McDermott

Data science fellow with background in institutional trading.
View all posts by Liam McDermott >

Jan Ruffner

View all posts by Jan Ruffner >

Leave a Comment

No comments found.

View Posts by Categories

All Posts 2399 posts
AI 7 posts
AI Agent 2 posts
AI-based hotel recommendation 1 posts
AIForGood 1 posts
Alumni 60 posts
Animated Maps 1 posts
APIs 41 posts
Artificial Intelligence 2 posts
AWS 13 posts
Banking 1 posts
Big Data 50 posts
Branch Analysis 1 posts
Capstone 206 posts
Career Education 7 posts
CLIP 1 posts
Community 72 posts
Congestion Zone 1 posts
Content Recommendation 1 posts
Cosine SImilarity 1 posts
Data Analysis 5 posts
Data Engineering 1 posts
Data Engineering 3 posts
Data Science 7 posts
Data Science News and Sharing 73 posts
Data Visualization 324 posts
Events 5 posts
Featured 37 posts
Function calling 1 posts
FutureTech 1 posts
Generative AI 5 posts
Hadoop 13 posts
Image Classification 1 posts
Innovation 2 posts
Kmeans Cluster 1 posts
LLM 6 posts
Machine Learning 364 posts
Marketing 1 posts
Meetup 144 posts
MLOPs 1 posts
Model Deployment 1 posts
Nagamas69 1 posts
NLP 1 posts
OpenAI 5 posts
OpenNYC Data 1 posts
pySpark 1 posts
Python 16 posts
Python 458 posts
Python data analysis 4 posts
Python Shiny 2 posts
R 404 posts
R Data Analysis 1 posts
R Shiny 560 posts
R Visualization 445 posts
RAG 1 posts
RoBERTa 1 posts
semantic rearch 2 posts
Spark 17 posts
SQL 1 posts
Streamlit 2 posts
Student Works 1687 posts
Tableau 12 posts
TensorFlow 3 posts
Traffic 1 posts
User Preference Modeling 1 posts
Vector database 2 posts
Web Scraping 483 posts
wukong138 1 posts

Our Recent Popular Posts

AI 4 AI: ChatGPT Unifies My Blog Posts
by Vinod Chugani
Dec 18, 2022
Meet Your Machine Learning Mentors: Kyle Gallatin
by Vivian Zhang
Nov 4, 2020
NICU Admissions and CCHD: Predicting Based on Data Analysis
by Paul Lee, Aron Berke, Bee Kim, Bettina Meier and Ira Villar
Jan 7, 2020

View Posts by Tags

#python #trainwithnycdsa 2019 2020 Revenue 3-points agriculture air quality airbnb airline alcohol Alex Baransky algorithm alumni Alumni Interview Alumni Reviews Alumni Spotlight alumni story Alumnus ames dataset ames housing dataset apartment rent API Application artist aws bank loans beautiful soup Best Bootcamp Best Data Science 2019 Best Data Science Bootcamp Best Data Science Bootcamp 2020 Best Ranked Big Data Book Launch Book-Signing bootcamp Bootcamp Alumni Bootcamp Prep boston safety Bundles cake recipe California Cancer Research capstone car price Career Career Day ChatGPT citibike classic cars classpass clustering Coding Course Demo Course Report covid 19 credit credit card crime frequency crops D3.js data data analysis Data Analyst data analytics data for tripadvisor reviews data science Data Science Academy Data Science Bootcamp Data science jobs Data Science Reviews Data Scientist Data Scientist Jobs data visualization database Deep Learning Demo Day Discount disney dplyr drug data e-commerce economy employee employee burnout employer networking environment feature engineering Finance Financial Data Science fitness studio Flask flight delay football gbm Get Hired ggplot2 googleVis H20 Hadoop hallmark holiday movie happiness healthcare frauds higgs boson Hiring hiring partner events Hiring Partners hotels housing housing data housing predictions housing price hy-vee Income industry Industry Experts Injuries Instructor Blog Instructor Interview insurance italki Job Job Placement Jobs Jon Krohn JP Morgan Chase Kaggle Kickstarter las vegas airport lasso regression Lead Data Scienctist Lead Data Scientist leaflet league linear regression Logistic Regression machine learning Maps market matplotlib Medical Research Meet the team meetup methal health miami beach movie music Napoli NBA netflix Networking neural network Neural networks New Courses NHL nlp NYC NYC Data Science nyc data science academy NYC Open Data nyc property NYCDSA NYCDSA Alumni Online Online Bootcamp Online Training Open Data painter pandas Part-time performance phoenix pollutants Portfolio Development precision measurement prediction Prework Programming public safety PwC python Python Data Analysis python machine learning python scrapy python web scraping python webscraping Python Workshop R R Data Analysis R language R Programming R Shiny r studio R Visualization R Workshop R-bloggers random forest Ranking recommendation recommendation system regression Remote remote data science bootcamp Scrapy scrapy visualization seaborn seafood type Selenium sentiment analysis sentiment classification Shiny Shiny Dashboard Spark Special Special Summer Sports statistics streaming Student Interview Student Showcase SVM Switchup Tableau teachers team team performance TensorFlow Testimonial tf-idf Top Data Science Bootcamp Top manufacturing companies Transfers tweets twitter videos visualization wallstreet wallstreetbets web scraping Weekend Course What to expect whiskey whiskeyadvocate wildfire word cloud word2vec XGBoost yelp youtube trending ZORI

NYC Data Science Academy

NYC Data Science Academy teaches data science, trains companies and their employees to better profit from data, excels at big data project consulting, and connects trained Data Scientists to our industry.

NYC Data Science Academy is licensed by New York State Education Department.

Get detailed curriculum information about our
amazing bootcamp!

Please enter a valid email address
Sign up completed. Thank you!

Offerings

  • HOME
  • DATA SCIENCE BOOTCAMP
  • ONLINE DATA SCIENCE BOOTCAMP
  • Professional Development Courses
  • CORPORATE OFFERINGS
  • HIRING PARTNERS
  • About

  • About Us
  • Alumni
  • Blog
  • FAQ
  • Contact Us
  • Refund Policy
  • Join Us
  • SOCIAL MEDIA

    ยฉ 2025 NYC Data Science Academy
    All rights reserved. | Site Map
    Privacy Policy | Terms of Service
    Bootcamp Application