Performance Data Analysis on Long-term Cycling
The skills I demoed here can be learned through taking Data Science with Machine Learning bootcamp with NYC Data Science Academy.
Background
Strava is the most popular online platform for cylists to upload and analyze their data. There is a lot of data generated from on-board sensors: speed, power, cadence, and location. Strava - especially the Strava Premium - also has a lot of great tools for analyzing within-ride data, such as time spent in different power zones, or how your times compare on the same section of road in your neighborhood. I wanted to analyze not just the specifics of a ride, but myself as an athlete over time. Basically, I wanted to know if I was getting stronger. I also wanted to gain insights on how to train better.
Here is an example of a Strava activity page.

How would these numbers trend over time? What could I learn from these trends?
It would be too difficult to go page by page and record these values as I have hundreds of activities. Instead, I scraped the data automatically using the Scrapy python framework. To learn more, please see the Methodology section of this post.
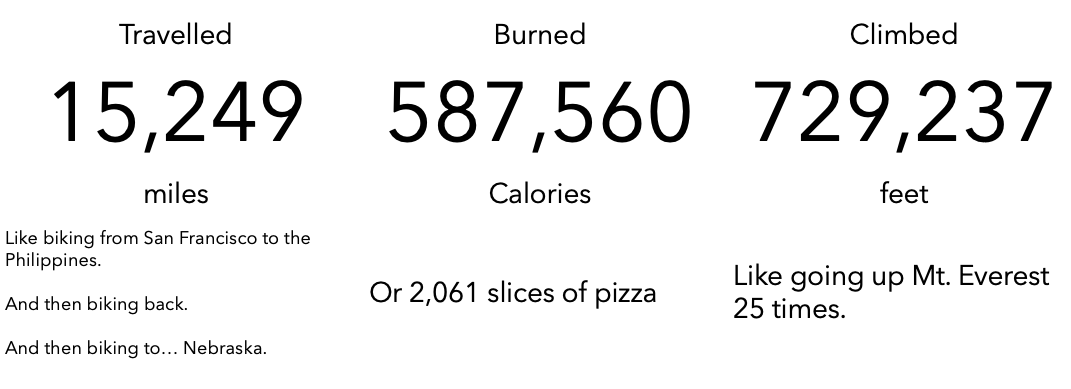
First, the fun stuff! In all of my Strava-recorded history, I have...

Data
Now for the more technical analysis. Not all rides are the same. Simply asking if I am "getting faster" over time is not enough. The difficulty of a ride is dependent primarily on gravity, aerodynamics, and distance. To make rides more comparable, I grouped them into mechanical energy spent. Let's take a look at the distribution of energy in kilo-joules.
Distribution of energy in kilo-joules of all rides with bin size = 500 kJ.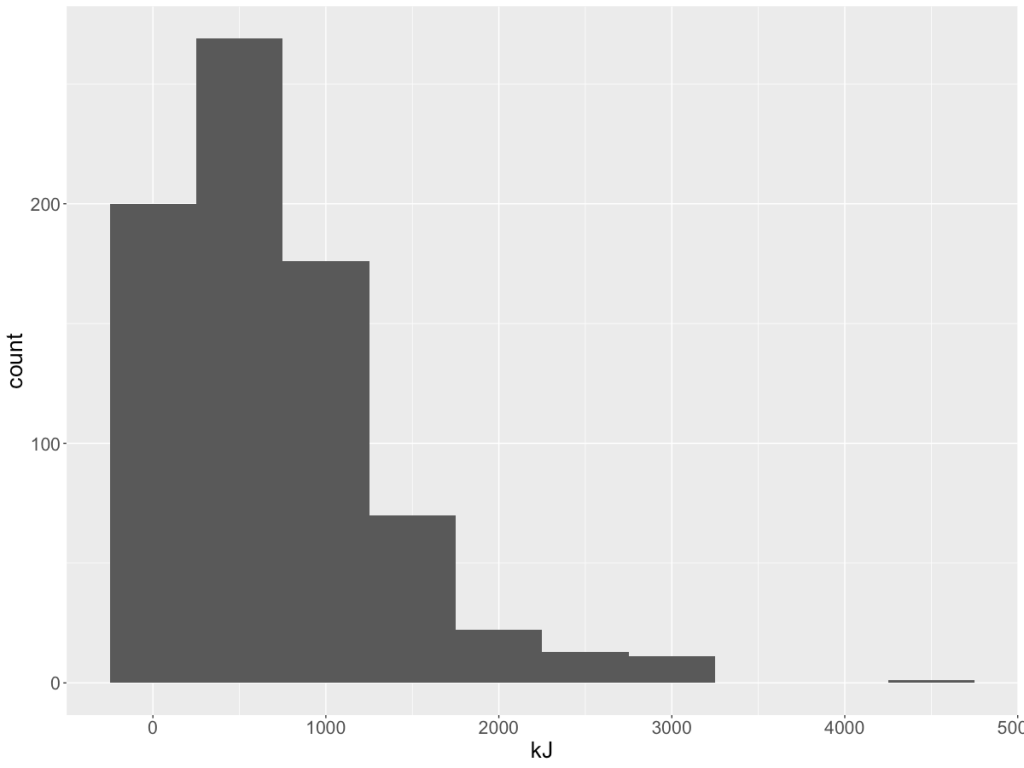
Data Table
The first four bins capture most of the data. Here is a table to give a rough idea of how kJ translates to mileage and climb.
| rough mileage range | rough climbing range | |
|---|---|---|
| under 250 kJ | up to 10 miles | 350 ft |
| 250 kJ to 750 kJ | 10 to 20 miles | 350 ft to 1000 ft |
| 750 kJ to 1,250 kJ | 20 miles to 34 miles | 1,000 ft to 2,000 ft |
| greater than 1,250 kJ | 34 miles to 62 miles | 2,000 ft to 4,000 ft |
I can then bin my rides accordingly and see if my average weighted power is trending over time. Power is the best metric because it factors in all the different variables (rate of climb, aerodyanamics, speed, rolling resistance, weight) into a single number.
Average weighted power (watts) over the years by ride total energy (kJ)
Data Analysis
It is important to note that a good training plan is not about always going for maximum wattage. One must train at the different power zones to build different metabolic systems of the body. However, power must on average increase if training is effective.
The A) chart is the noisest. This bin includes the "easy" rides like warm-ups, cool-downs and commutes. I am not surpised since I don't strictly train for power in this energy bin.
B), C), and D) tell a similar story. I have been improving over the years, but my improvement has been tapering off. How I will do in 2020 is yet to be seen.
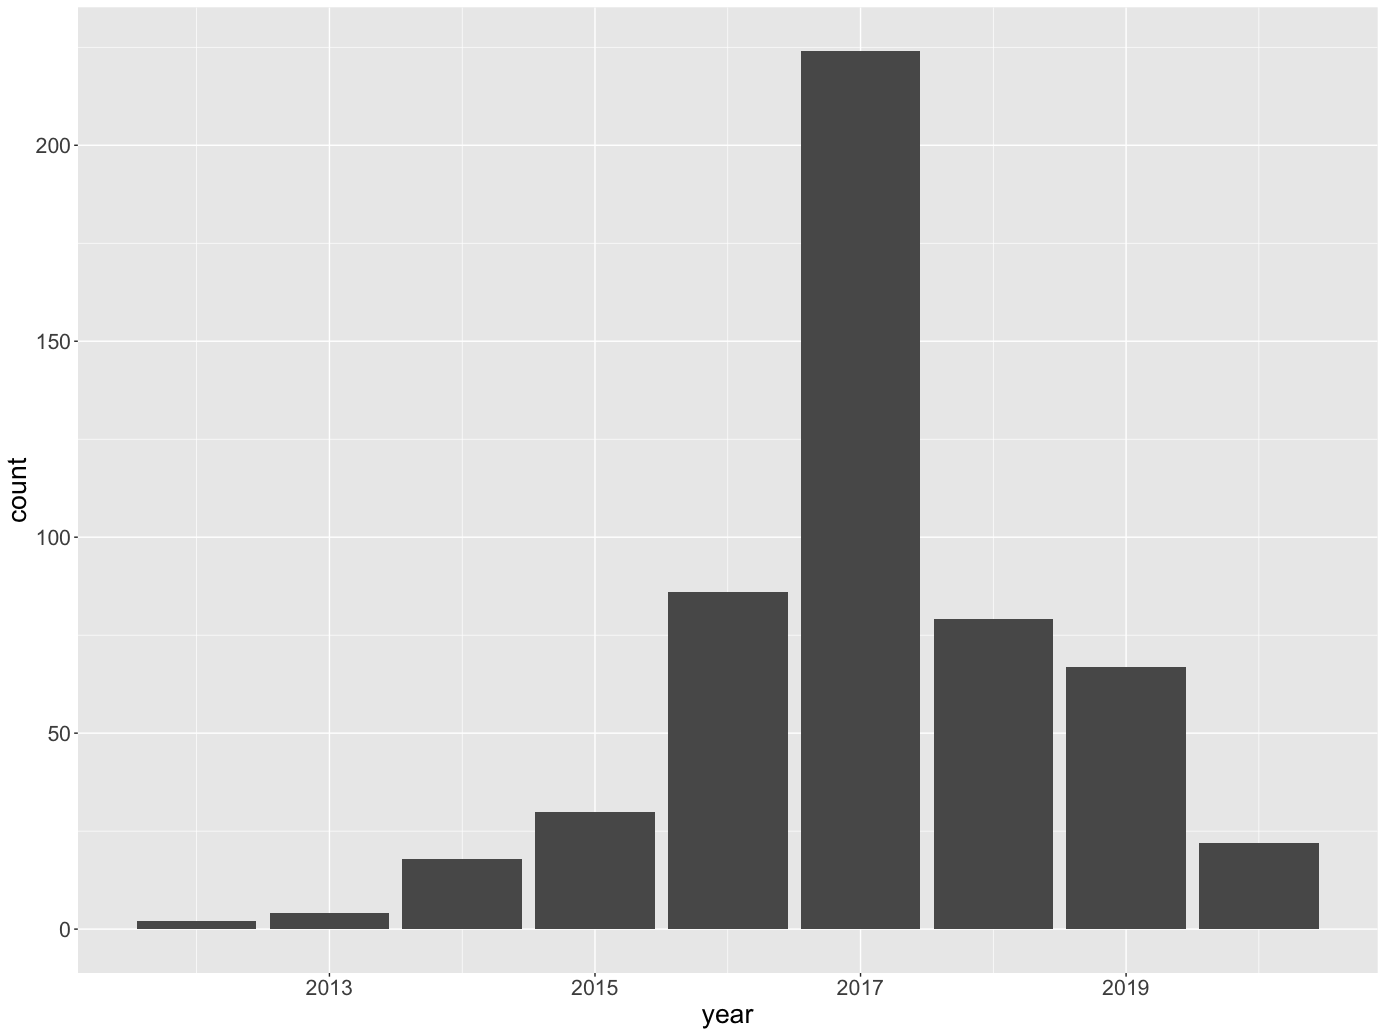
It is noticeable that I have a lot more data 2017 with a much wider spread. Let's take a look at my frequency of rides.
Riding days per year
Observations
It looks like I have been... slacking. 2017 was a big year for me as I got into racing, and immersed myself in a great cycling community in Oregon.
There is also another interesting observation in 2017: I have a lot of rides in the 250 to 750 kJ range with high wattage: in the 250 to 300+ range. Consider that my functional threshold power at the time was around 294 watts. This is the maximum wattage I could theoretically put out over an hour if I gave my all-out hold-nothing-back effort. Filtering for 2017, 250 to 750kJ with wattage greater than 250 watts, there are 10 points with the following statistics:
- average distance: 15 miles with sigma = 5 miles.
- Average moving time: 45 miles.
Directly inspecting on Strava, these were mostly my races on the Portland International Raceway and my FTP test rides.
Since then, I have not been riding as much since my non-cycling life has required a lot of attention. I need to ride more!
Nutrition & Calories
A key part of training isn't just about what I do on the bike. It is also about nutrition. How much should I be eating to sustain a cyclist lifestyle?
Calories distribution colored by day of ride
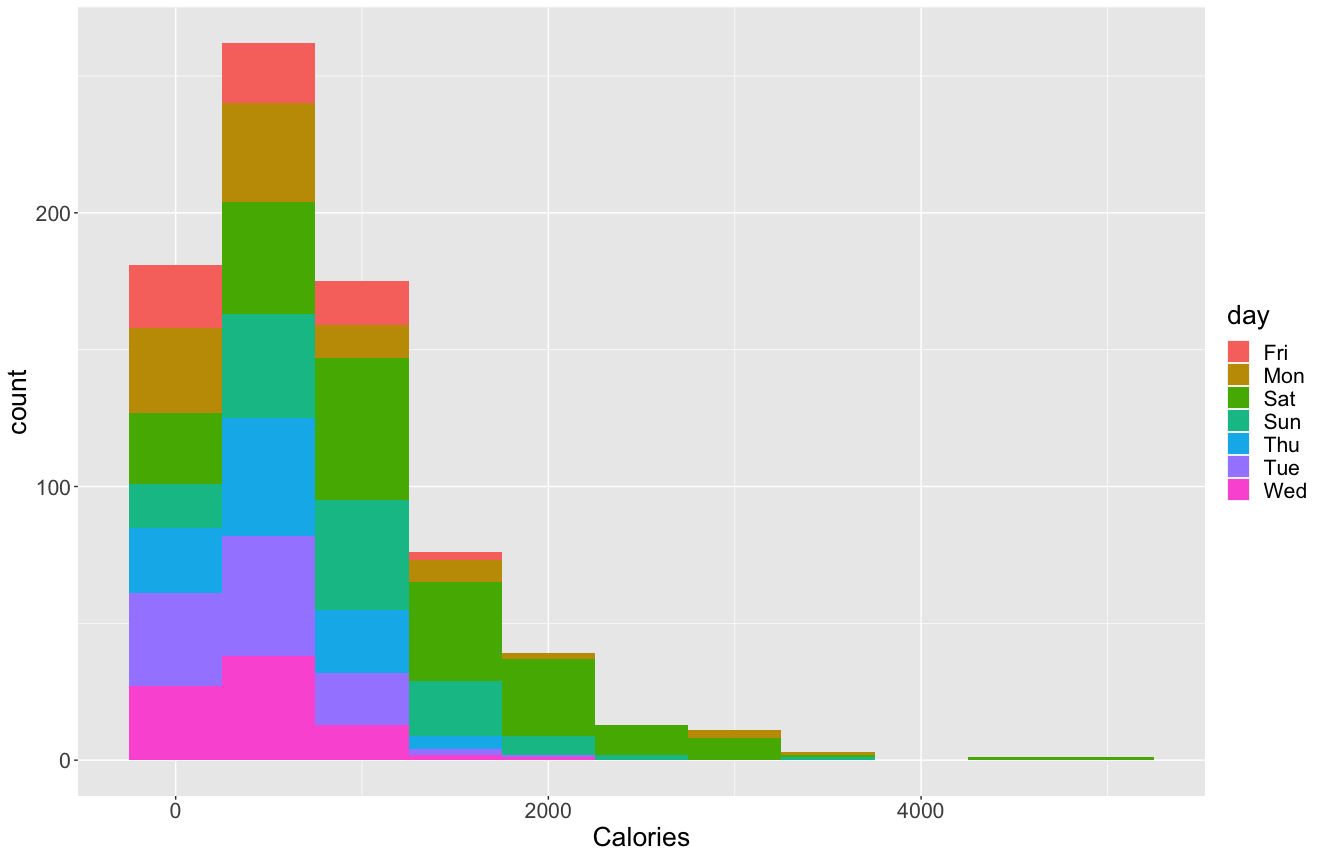
Most of my rides throughout the week can burn just under 1,000 Calories. But on Satuday, I tend to burn a lot more, averaging at around 1,500 Calories. This will help me plan how much to eat. I hope that I will also make good choices on what to eat.
Cadence
I can improve my efficiency on the bike by understanding my cadence, which is how fast I spin the pedals. I could go for harder gears to spin slower or go on easier gears to spin faster for the same speed. Understanding my cadence distribution can help me choose what cadence to spin.
Cadence (rpm) distribution

This indicates I naturally prefer 95 rpm, which is suprising to me because I always felt I was more of an 85 kind of guy. Given this data, I will target 95 rpm on long rides when I am just cruising.
Overall, this is my message for myself:
You are getting stronger, but you need to ride more!
Methodology
If you are a cyclist on Strava and would also like to analyze data, message me. I am happy to help you!
I used Scrapy to web-scrape, and R to analyze and generate graphs. The code can be found on my GitHub repo:
https://github.com/lorenzom21/stravascrape
After logging in to Strava, go to the My Activities section.
https://www.strava.com/athlete/training
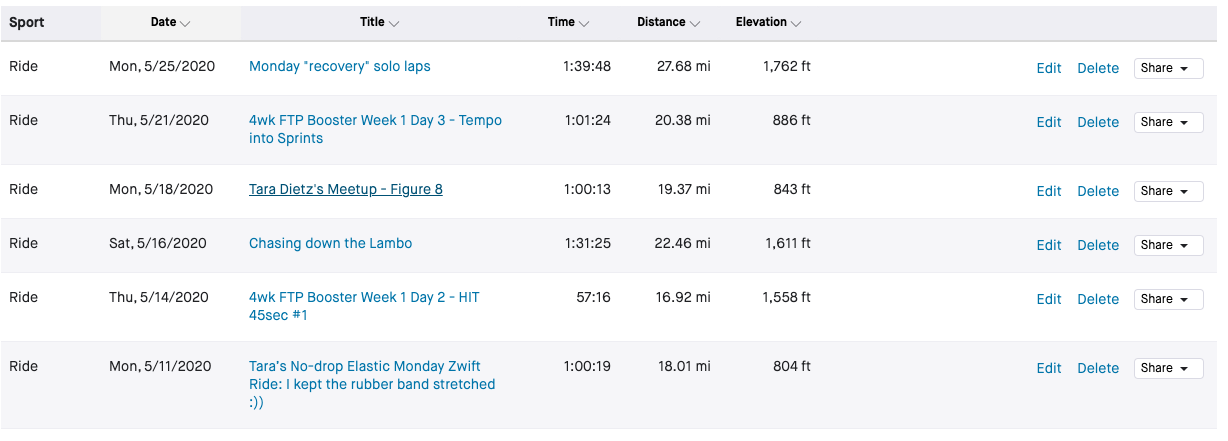 When you page through your activities, you are not actually going to different web page. This is a single web page with a JSON object feeding into it via a GET request. Every time you click for the next page, a new object is requested and used to repopulate the data.
I reverse-engineered the GET request by using Chrome's developer tools. I replicated this request in my code, including the headers. Then I scraped all my activities for the activity ID. This is needed because it is used in the URL for the activity page itself. The URL format is:
https://www.strava.com/activities/{activity id}
With activity ID's on hand, I scraped all the activity pages for the numbers I care about. Here is the image again:

After scraping, I end up with two tables. The first is from scraping the My Activities page, and the second is a collation of the data from the various activity pages. I then join these two tables via the ride id column.
From there, I load up the data in R studio and begin slicing and dicing and charting with R's dplyr and ggplot2 package.

