Predicting Taxi Medallion Value: Part 3
Introduction
A prominent hedge fund, our project sponsor, has invested in a large number of Yellow Taxi Medallions. As we're moving past the pandemic lockdowns, they're keen to reassess this investment's potential value. Traditionally, they would use standard financial methods for this. However, this time, they're open to exploring modern techniques, such as machine learning, to predict future values.
What is a taxi medallion?
Taxi medallions are basically special permits that allow a taxi to operate in a specific city. In this case, we're focusing on New York City. These medallions can be owned by individual taxi drivers, taxi companies, or investors like our sponsor, and in that way they are considered an asset. In 2012, their value peaked at approximately $800,000 per medallion. Medallions are regulated by the New York Taxi and Limousine Commission (TLC), and there are currently nearly 13,500 in circulation.
Data
We found valuable data from NYC Open Source. It led us to the Taxi and Limousine Commission (TLC), which provides data on monthly medallion transactions and meter data from the vehicles themselves. Meter data includes the fair, distance, time and location of pickup among other information.
This meter data is presented in three ways: yearly, monthly, and daily. The most recent yearly data is from 2019.
The daily data was tremendous in size and therefore required lengthy time allocation for processing. Every year the data was ~20gb. Considering the heavy processing requirements, we chose to analyze the past 12 months of daily data, so that we could check the monthly data for discrepancies.
The monthly data was not provided directly. There was a link to it as a source in the TLC data app. This gave us monthly records dating back to 2010, offering a broad dataset for our analysis.


Exploratory Data Analysis: Essential Takeaways
Driving Forces Behind Annual Income Growth
Yellow Taxi's annual income is getting back to the levels seen before the pandemic. This is primarily due to two significant changes:
- Taxi Fare Increase: Taxi fares saw a rise in December 2022, with the average cost per ride going up by about $5, an increase of more than 25%.
- 2. E-hailing for Yellow Taxis: The Taxi and Limousine Commission introduced a program that enables Yellow Taxis to be hailed through an app, much like Uber.


Counteracting Factors
Active Medallions on the Rise: The number of active taxi licenses, known as medallions, is increasing. Although this could result in lesser income per taxi, the overall trend still indicates growth, with about 7,000 medallions – half of the total – registering activity each month.
Potential Risk Factors
The data indicates that, while taxi rides have become more expensive and can now be hailed via an app, the rising number of active taxis could potentially reduce the earnings for each taxi. There's also the chance that higher prices might discourage riders.
Challenges for Prediction Models
These dynamics add a layer of complexity to the prediction of future prices. Our model's understanding of the long-term impacts is limited as we have only four months of data since the fare increase.
Given these complexities, we moved ahead, eager to see how far the data we have could lead us in our predictions.
Machine Learning: Our Approach
What are we predicting?
The monthly medallion transaction reports, unfortunately, weren't useful because they lacked specific closing dates. This meant a report from May 2023 includes prices from earlier months.
After consideration, we decided on the following approach: Understand the annual return potential of a medallion, and from there, estimate its value.
Taking the First Step
The initial step was simple: evaluate the performance of univariate time series models. If they showed potential, we should dive deeper.
Univariate time series models are machine learning tools that predict future values based solely on its past value. For instance, predicting future temperatures based solely on past temperatures.
It's important to note that we did not modify these models to enhance their potential, so their results represent a worst-case scenario.
Defining Success
We assessed the success of these models by comparing their predicted values with the actual values during the same period. We achieved this by performing a train-test split. The machine learning model is trained on data up until the test period - in our case, up until April 2022. The model uses this training data to learn the trends, direction, and other factors of the historical data and predict the values for the test period. Our test period spans the last 12 months of data we have -—from May 2022 to May 2023.
Initial Results
The black line in the graph represents actual values (my apologies for not including a legend this time). You can disregard the model types at this stage, as they aren't relevant yet.
Notice the green line, which aligns exceptionally well with the actual values. This encouraging result was a clear signal to us to delve deeper into our analysis.

Crunching the Numbers with Models
Enhancing Models
To make the models more effective, we used a variety of data transformations — changes made to the numerical values. The goal was to test how robustly the model responded to each transformation. Additionally, we experimented with different seasonalities or trends that recur over specified periods, such as annually or quarterly. Lastly, each model had unique hyperparameters that we could further optimize. For example, in Holt Winters model, we tested eight different methods or algorithms.
The revised goal of our project then became: to examine the initial stage of predictive modeling using univariate time series as deeply as possible to identify next steps.

Second Round of Testing
The second run of the models turned out to be quite successful. The predictions for the last 12 months closely matched the actual data for each model. On average, the predictions deviated by a promising 3.25% to 5.12%.
The maximum error values, however, were more concerning due to their potential impact. An 8.5% error would translate to an $8,500 loss per $100,000 invested - a substantial hit for a business.

A Curious Outcome
There was an aspect of the results that puzzled me: the fare change. Despite none of the models having access to data post the fare change, they predicted the annual revenue for that period surprisingly well. This discrepancy seemed odd.
Typically, fare changes can drastically affect taxi revenues. Therefore, it was unexpected for the models to generate accurate predictions without considering this change. This led me to question: Did the models get lucky this time, or is there a piece of the puzzle I'm missing?

Calculating Annualized Revenue
Given the encouraging results from the second pass, we decided to dive deeper, exploring various methods to calculate annualized revenue. Our aim was to identify formula that yielded the most accurate predictions. To this end, we used our four chosen models across ten additional datasets in different combinations, resulting in a total of 18 unique methods for predicting future annualized revenue.
We attempted multiple variations of the formula for annualized revenue, incorporating factors such as daily revenue, revenue per ride, the number of Yellow Taxi rides, the total number of vehicles, and the proportion of Yellow Taxis in the vehicle mix.
Despite the complexity of our exploration, the simplest method turned out to be the most accurate: Predicting annualized revenue by simply multiplying daily revenue by 365. For clarity, here are the top three performing methods:

Refining Predictions with Shorter Intervals
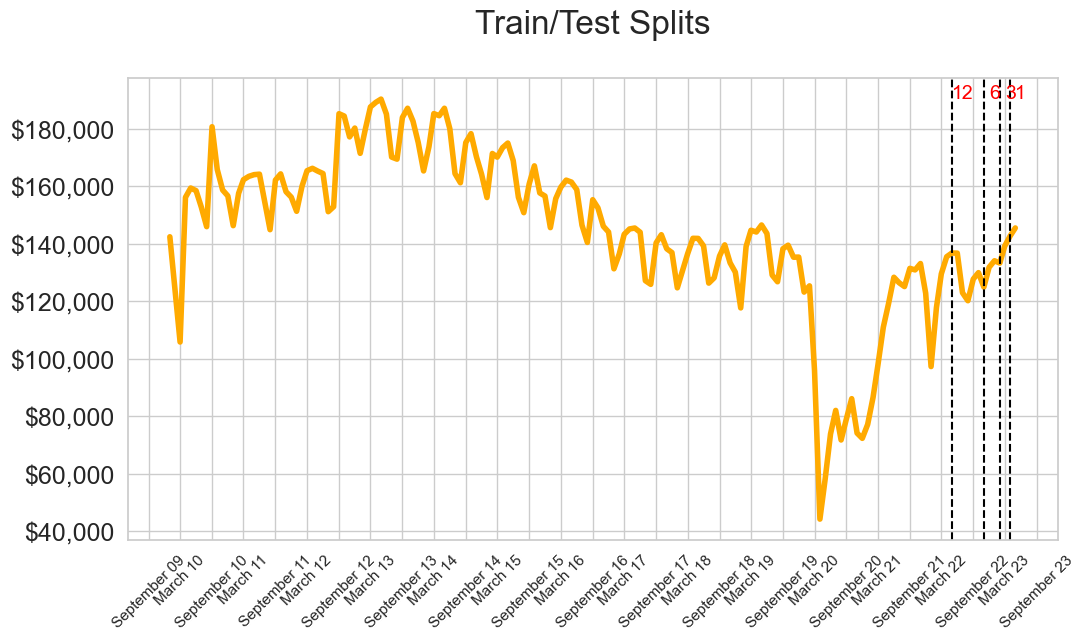
Recognizing the influence of recent fare changes on annualized revenue predictions, we decided to train the models using shorter time frames. We set the models to learn from all available data, and then predicted values for the last 6 months, 3 months, and 1 month.
The 1-month prediction window yielded the most accurate results, with a worst-case Mean Absolute Percentage Error (MAPE) of just 0.13%. This means that for every $100,000 of revenue, the predictions varied by less than $130 from the actual value. That’s quite a testament to the precision of these models!
The 3-month predictions also surpassed the 12-month ones, with the Holt Winters model demonstrating remarkable accuracy, deviating by only 0.21% from the actual values. That's equivalent to a $210 deviation per $100,000 of actual value.
Surprisingly, the 6-month model performed the worst. This helped us understand the model's learning patterns—the 6-month model couldn't account for the fare increase and lacked access to earlier, unaffected data. As a result, it struggled to predict accurately when confronted with unexpected trend changes.
The 12-month model benefited from predicting values before the fare change, which likely improved its performance. However, this could have also been a matter of chance

Robust Testing Model Performance
In order to assess the effectiveness of our 1-month and 3-month forecasting models, we implemented a strategy known as a walk-forward validation. This approach consists of setting a series of testing intervals (12 in our case) to repetitively evaluate the model's predictive power.
To illustrate, in a 1-month forecasting scenario, the model would initially use all data prior to the 12th-last month to predict that month's outcome. It would then "walk forward" one month, utilizing all preceding data to forecast the next month's outcome, and so on until all available data is exhausted.
We evaluated the performance of each model based on the minimum, mean, and maximum percentage which the prediction was off from the actual value.
3-Month Walk Forward Cycle
The model's performance under this cycle was initially underwhelming, which could be attributed to the pandemic's substantial impact on recent history.In hindsight, implementing a 1-month forward movement instead of 3 months would have provided a more useful total period range of 18 months, rather than the 36-month one used. This cycle's performance was understandably poor, as it sought validation during the pandemic period when the divergence from historical trends was most pronounced. The maximum error here is especially noteworthy and cause for concern.

1-Month Forward Model
The 1-month forward model outperformed the others. The best performing model under this condition needed only a few months to adjust for the fare increase. We observed this in the December 2022 prediction where the actual annualized revenue started to rise. The model quickly learned and made predictions within very close ranges. Therefore, we anticipate that the model's accuracy will improve significantly over time as it continues to adjust to changes.

Conclusion
Despite the inherent complexity of predicting taxi revenues - an endeavor influenced by a multitude of factors and dynamic shifts in trends - our univariate time series models demonstrated commendable accuracy. They managed to capture pivotal turning points in the data, such as the surge in app-based transportation in 2012, the pandemic-induced downturns from 2020 to 2022, and the recent fare increase and rise of medallion hailing apps in late 2022.
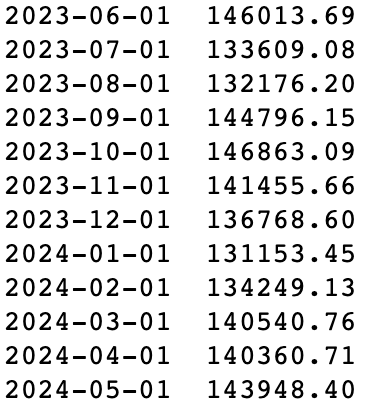
Projected Revenues
As we confirmed the validated accuracy of one-month predictions, barring extreme events, we strongly anticipate the first month to yield deviating from the actual figures by approximately 3%.
Future Work
We believe our results demonstrate great promise to improve prediction accuracy and range. We propose the following to achieve just that:
- Incorporate additional data pertaining to factors like weather, crime rates, and office occupancy rates that can potentially affect taxi revenues.
- Experiment with a diverse range of data combinations and transformations to ascertain optimal model performance.
- Modify the 3-month backtest to roll forward in 1-month increments instead of 3.
- Apply these models to pre-pandemic data (2017-2019) to assess their performance under different conditions.
- Conduct field research by interviewing taxi drivers to gain insights into recent fare increases, app bookings, and their expectations for the future.
- Begin to follow top voices that impact the future of taxi rides.
A word about the models used:
- Holt-Winters: This time series forecasting model applies exponential smoothing to capture patterns and predict future trends based on past data. With its ability to account for seasonality, trend, and level components, Holt-Winters is especially useful for data with recurrent patterns.
- AutoARIMA: Standing for AutoRegressive Integrated Moving Average, AutoARIMA is an automated version of the ARIMA model. It automatically identifies the best parameters (p, d, q) to fit the model to the data at hand, making it a versatile and popular choice for forecasting a wide variety of time series patterns.
- SARIMAX: An extension of the ARIMA model, SARIMAX adds additional terms for seasonality and exogenous variables. This allows it to manage time series data influenced by seasonal patterns and external factors, making it a powerful tool for forecasting and understanding the effects of various variables on the time series.
- Prophet: Developed by Facebook, Prophet uses an additive model to take into account trends, seasonality, and holiday effects. Its ability to handle irregularities and outliers in time series data, along with providing flexible modeling options and user-friendly, interpretable results, makes it an effective forecasting tool.