Property Data Analysis I: House Prices in Iowa
The skills I demoed here can be learned through taking Data Science with Machine Learning bootcamp with NYC Data Science Academy.
The 60 second summary
- House prices in Ames, Iowa can be predicted to ~ +/-12% accuracy using models with 80+ factors
- Heuristics are not the best guide for prices but simple models can provide good accuracy
- Complex models and stacking can be used to obtain a top 15% Kaggle score, but this comes at the expense of overfitting risks and reduced transparency
- For data science projects as part of a small team, a modular approach with upfront investment in feature engineering and functional programming can pay dividends
Aims for Ames
We are trying to predict house prices in Ames, Iowa using a training ~0.5MB dataset with around 1500 observations and 80 variables. (The associated Kaggle competition describing the data set and target variable in more detail can be found here.) The variables included in the data set include information about the size, quality, location, and features of each property and the conditions surrounding its sale. In line with the rules of the associated Kaggle competition, we did not enrich the data provided with additional outside information.
From the outset, we had three related objectives in mind:
- To design a simple model that could identify which factors explain local housing prices in Ames
- To build a model using more complex modelling techniques that could further reduce our prediction error
- Find an efficient strategy for working collaboratively across a pipeline
Our forecasting metric is the root mean squared error on the logged sale price (RMSLE). Using this metric means we view a 1% error on a 150k and 300k house to be equivalent.
Team Approach
We are a team of data scientists with complementary backgrounds in economics, science, finance and linguistics.
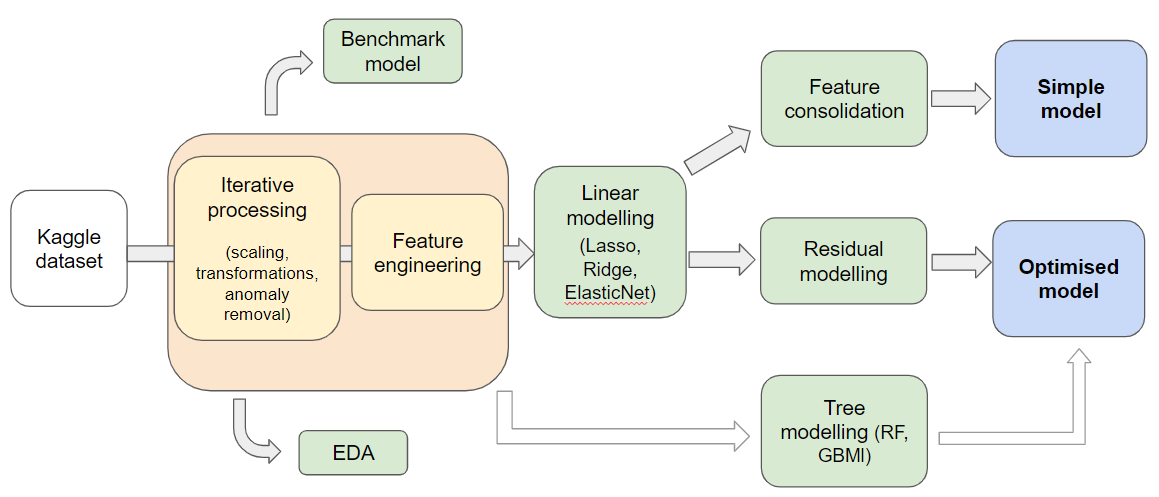
We recognised that we would need to transform and process the core data for both the simple and optimised model, so we needed to set up a flexible “pipeline” without segregated data sets and notebooks.
This pushed us towards a more modular approach, where data processing steps are designed as functions which can be repeatedly called rather than using one-off processing steps.
Data cleaning and feature engineering
There are a few distinct considerations that dictated our approach to data cleaning and feature engineering.
The first aspect of this project that influenced our approach is that the training set only contains around 1500 rows. While this simplifies the process of loading, manipulating, and modifying this data set, it creates an additional challenge of avoiding overfitting given that the test data set is roughly the same size as the training data set. To avoid overfitting, our approach was to generate validation data sets that could be used to test model performance and fit hyperparameters that would then be used to estimate predictions on the test data set.
Our approach to data cleaning and feature engineering was also influenced by the fact that different approaches to encoding categorical data and imputing data were needed to estimate separate tree and linear models. On top of this, there were a number of modeling decisions (e.g., How to drop outliers? Whether to square or log certain variables?) where there was no clear answer a priori and so we wanted to determine which data cleaning approach produced the best results.
Given these concerns (and our desire to ensure that train/validation/test data sets were modified in equivalent ways), our group spent extra time designing a function that would generate the required number of data sets and modify them using the procedures defined by the function’s parameters. We found that this approach was very helpful in making code easier to read and allowing us to easily and empirically test how different data cleaning approaches performed when modelling on the validation data set.
Feature engineering
One last aspect of our feature engineering approach that is worth commenting on is how we decided which new features we wanted to add to our data set. While some new features were identified through introspection, a number of features were identified by combining information from multiple variables that were found to be strongly correlated.
For example, various quality measures were found to be closely correlated, which led us to generate a single average quality measure as well as counts of the number of variables in different quality categories to incorporate information from multiple different categorical variables into a more parsimonious number of variables.
We found dendrograms particularly helpful in visualizing the clustering of different variables based on their respective correlations, with groups of variables that were particularly correlated with each other appearing clustered together. This approach allowed variables that could be combined into a smaller number of derived factors to be easily identified.
Modeling approach
To get a sense of what baseline level of forecasting performance might be achieved using very basic statistical techniques and some baseline knowledge of the housing industry, we ran a non-regularized OLS model using a series of intuitive features. After some discussion, our group decided that we could best approximate the knowledge of a domain expert by looking at which sources of information were commonly reported on multiple real estate comparison and advertising sites.
After identifying ten features of this type (and turning these features into a total of 44 variables), we were left with a model whose prediction performance would serve as our baseline. Our average cross-validation RMSLE was 0.16 and our test RMSLE was 0.15, which made this model the only one that we examined that performed better on the test data set than the cross-validation data sets.
While this indicates that our baseline model was not subject to overfitting issues, we were confident that we could do better (and we were even able to identify a linear model using Lasso that performed better while including far fewer features).
Outset
From there, we started modeling immediately so we could see from the outset which models would work best. We explored linear models such as Ridge, Lasso and Elastic Net. The nature of Ridge is that the coefficients never in fact reach zero so one keeps all of the predictors fed into it whereas Lasso will cull superfluous predictors.
Given that we were attempting to create a high performing model with relative transparency, keeping irrelevant predictors from the 80 odd variables in the original dataset would not be ideal, not to mention after we’d added new variables through one-hot-encoding and feature engineering. Lasso outperformed Ridge prior to pre-processing anyway so it was an easy decision to move forward with Lasso. Elastic Net, which tries to find a happy medium between Ridge and Lasso, had similar results to Lasso, but for the sake of simplicity we proceeded with Lasso.
Model
We wanted to see how accurate a model could be with minimal predictors. A heavily penalized Lasso model with only 9 predictors scored a cross validated RMSLE of 0.17 which was slightly worse than the intuitive OLS on heuristics albeit with fewer variables.
We found that the optimal number of predictors after feature engineering and one-hot-encoding was 80, ironically the same number of variables that we started with. However, this was in fact only 20% of the variables that we fed into the Lasso model. This model scored a competitive 0.1202 on the Kaggle test set, fulfilling our primary goal to create a high performing and parsimonious model.
We also explored nonlinear tree models, in particular random forests and gradient boosting techniques. These proved to be useful out-of-the-box as less data engineering is required; in particular random forests offered a quick way to assess variable importance and test out new features.
Model stacking
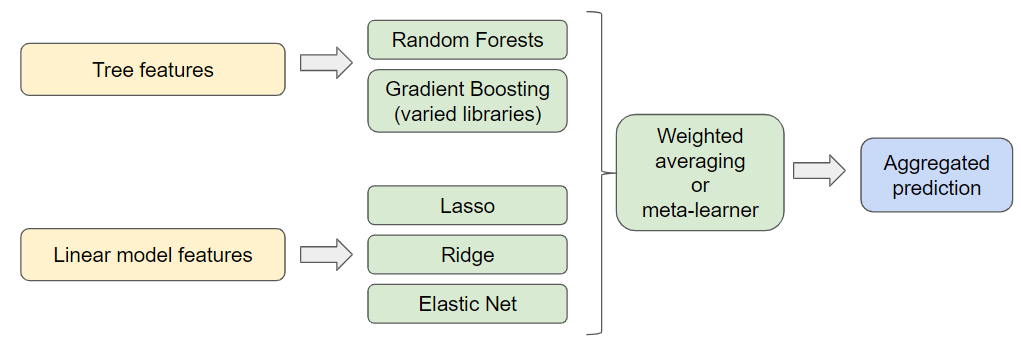
Our initial feature engineering modelling efforts produced good results - but to achieve our secondary goal we needed to explore some more sophisticated modelling techniques. It is common practice on Kaggle to use model ensembling/stacking - we investigated two approaches to model stacking which we refer to as parallel and sequential stacking.
Parallel stacking is the idea that we could combine our separately trained models to produce an overall estimate where noise and overfitting is cancelled out. However, not all of the residuals in a model are due to noise so there is a danger of diluting the good performance of our Lasso model with other worse performing models. There is also the question of how to weight the stacked model, with potentially extra weighting on a particular model.
Running all five of these models with cross validation and various different weightings on each model would take ages. Our best performing parallelly stacked model was with Lasso and Gradient Boosting, however, this approach did not improve on Lasso on its own so we changed tack. An illustration of the parallel stacking approach is shown below:
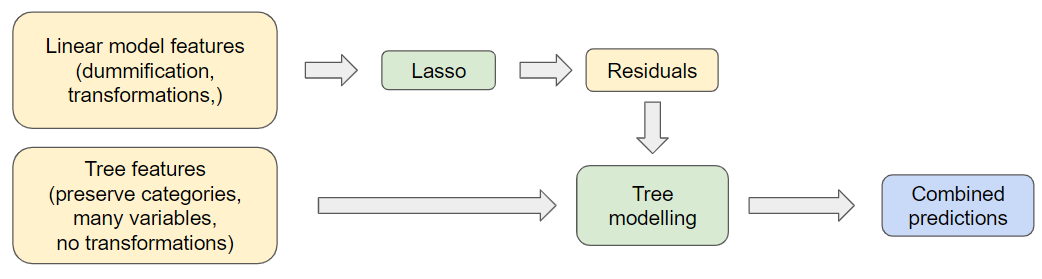
Through a sequential stacking approach, we hoped to take the strong results of our linear model and fit another model, a Random Forest, to capture any patterns in its residuals. This would allow our second model to limit the effect on our RMSLE of house prices which the linear model predicted poorly.
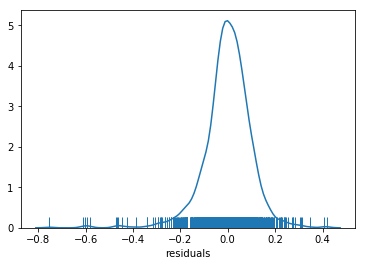
One pitfall which we had to be careful of was overfitting the residuals and capturing noise rather than signal. Empirically we found sequential stacking to be an effective way to reduce issues with outliers whilst maintaining a parsimonious model. An illustration of the sequential stacking approach we took is shown below:
Below is a comparison of the Kaggle scores for these two approaches:

Conclusions and future work:
While our group is generally satisfied with our models’ forecasting performance and our team’s general approach, we have a few ideas about how we might improve our final product.
First, given the general success that we had implementing a functionalized approach to feature generation and data cleaning, we think that we can make our existing code base faster, more readable, and easier to re-use by applying this approach to model estimation and visualization.
Second, we found that much of our tree modelling (particularly tuning parameters for the gradient boosting modelling we performed) took a significant amount of time and limited our ability to either use our local machines or our shared Kaggle kernel for significant lengths of time. Instead, we would ideally like to set up a Docker image with all of the files and Python modules needed to perform our analysis that could then be run from a high-performance AWS cluster to reduce the time required to edit and run our existing code.
Finally, one advantage that we had for modelling Iowa housing prices was that our test and train data sets covered relatively similar homes. This is evidenced by the fact that only seven of our 80+ features had significantly different distributions at the .15 level in the train and test sets (as measured using the Kolmogorov-Smirnov statistic for numerical data and a Chi-squared test for categorical data).
In our next project, we wish to generate prediction cases where the test data looks extremely different from the training data to get a better sense of the challenges that come from this form of prediction. This would, for example, be a huge concern for forecasting data one year using observations from another year.