NYC Data Science Academy| Blog
Bootcamps
Lifetime Job Support Available Financing Available
Bootcamps
Data Science with Machine Learning Flagship 🏆 Data Analytics Bootcamp Artificial Intelligence Bootcamp New Release 🎉
Free Lesson
Intro to Data Science New Release 🎉
Find Inspiration
Find Alumni with Similar Background
Job Outlook
Occupational Outlook Graduate Outcomes Must See 🔥
Alumni
Success Stories Testimonials Alumni Directory Alumni Exclusive Study Program
Courses
View Bundled Courses
Financing Available
Bootcamp Prep Popular 🔥 Data Science Mastery Data Science Launchpad with Python View AI Courses Generative AI for Everyone New 🎉 Generative AI for Finance New 🎉 Generative AI for Marketing New 🎉
Bundle Up
Learn More and Save More
Combination of data science courses.
View Data Science Courses
Beginner
Introductory Python
Intermediate
Data Science Python: Data Analysis and Visualization Popular 🔥 Data Science R: Data Analysis and Visualization
Advanced
Data Science Python: Machine Learning Popular 🔥 Data Science R: Machine Learning Designing and Implementing Production MLOps New 🎉 Natural Language Processing for Production (NLP) New 🎉
Find Inspiration
Get Course Recommendation Must Try 💎 An Ultimate Guide to Become a Data Scientist
For Companies
For Companies
Corporate Offerings Hiring Partners Candidate Portfolio Hire Our Graduates
Students Work
Students Work
All Posts Capstone Data Visualization Machine Learning Python Projects R Projects
Tutorials
About
About
About Us Accreditation Contact Us Join Us FAQ Webinars Subscription An Ultimate Guide to
Become a Data Scientist
    Login
NYC Data Science Acedemy
Bootcamps
Courses
Students Work
About
Bootcamps
Bootcamps
Data Science with Machine Learning Flagship
Data Analytics Bootcamp
Artificial Intelligence Bootcamp New Release 🎉
Free Lessons
Intro to Data Science New Release 🎉
Find Inspiration
Find Alumni with Similar Background
Job Outlook
Occupational Outlook
Graduate Outcomes Must See 🔥
Alumni
Success Stories
Testimonials
Alumni Directory
Alumni Exclusive Study Program
Courses
Bundles
financing available
View All Bundles
Bootcamp Prep
Data Science Mastery
Data Science Launchpad with Python NEW!
View AI Courses
Generative AI for Everyone
Generative AI for Finance
Generative AI for Marketing
View Data Science Courses
View All Professional Development Courses
Beginner
Introductory Python
Intermediate
Python: Data Analysis and Visualization
R: Data Analysis and Visualization
Advanced
Python: Machine Learning
R: Machine Learning
Designing and Implementing Production MLOps
Natural Language Processing for Production (NLP)
For Companies
Corporate Offerings
Hiring Partners
Candidate Portfolio
Hire Our Graduates
Students Work
All Posts
Capstone
Data Visualization
Machine Learning
Python Projects
R Projects
About
Accreditation
About Us
Contact Us
Join Us
FAQ
Webinars
Subscription
An Ultimate Guide to Become a Data Scientist
Tutorials
Data Analytics
  • Learn Pandas
  • Learn NumPy
  • Learn SciPy
  • Learn Matplotlib
Machine Learning
  • Boosting
  • Random Forest
  • Linear Regression
  • Decision Tree
  • PCA
Interview by Companies
  • JPMC
  • Google
  • Facebook
Artificial Intelligence
  • Learn Generative AI
  • Learn ChatGPT-3.5
  • Learn ChatGPT-4
  • Learn Google Bard
Coding
  • Learn Python
  • Learn SQL
  • Learn MySQL
  • Learn NoSQL
  • Learn PySpark
  • Learn PyTorch
Interview Questions
  • Python Hard
  • R Easy
  • R Hard
  • SQL Easy
  • SQL Hard
  • Python Easy
Data Science Blog > Student Works > Studying Data to Predict housing prices in the Ames, Iowa

Studying Data to Predict housing prices in the Ames, Iowa

Shiyu Li
Posted on Nov 27, 2018
The skills the author demoed here can be learned through taking Data Science with Machine Learning bootcamp with NYC Data Science Academy.

Introduction

It’s a challenge to come up with accurate predictions because they require great knowledge in machine learning and lots of practical experience. One recent project on the Kaggle: House Prices, Advanced Regression Techniques allowed competitors to forecast house prices in Iowa, by making a prediction on the basis of machine learning data algorithms.

All the code can be found here:

https://github.com/vickywinter/Predict-House-Price-

Working flow

The working flow the project is list as below. First big part will be data cleaning part, and the second part will be machine learning part.

  1. Loading Data
  2. Data Visualization
  3. Data Cleaning & Engineering
  4. Model Fitting
  5. Stacking
  6. Predicting

Data loading

All the data comes from the Kaggle. There are 1459 test house data and 1460 training house data.  Each has 80 features.

Data Visualization

Visualizing the data is a smart way to find relationship that could provide useful insights. Below is a correlation map that shows the 10 features that correlate most with sale price. We can see that features like overall quality and ground living area is highly positive related to the sale price.


           Studying Data to Predict housing prices in the Ames, Iowa

We can also clear out outlier by plot the features and sale price. I plot the scatter plot with the continual data and box plot with the categorical data. I removed two outliers that represent an unusually low sale price with high living from the set.

                                  Studying Data to Predict housing prices in the Ames, Iowa

                Studying Data to Predict housing prices in the Ames, Iowa

Most continuous data have a linear relationship with the sale price. The categorical data has different relationships with the sale price, but they tend to have a clear difference between each category.

The sale price shows a right skewed distribution that does not quite follow the Gaussian distribution. In order to build an accuracy regression model, the target value should follow a normal distribution, and we can achieve this by take log of the sale price.


Before log


After log

Data Cleaning & Engineering

There are lots of missing data points in the collected data. Most numeric missing features have been filled with median number in its groups or 0. Most categorical missing features have been filled by definition or by most frequent data.

One of the major work in this project is data engineering parts. This process can reduce the model complexity and increase the accuracy. As there are 28 features and almost 3000 data points, it’s necessary to reduce some features and keep only useful data. For example, all the garage information is highly correlated, so only “garage cars” is kept.  Other engineering like take log are also applied to the data.

Model Fit

I train the data with four different models:

  1. Lasso
  2. Ridge
  3. Random Forest
  4. Xgboost

For all the models, it is necessary to find the best hyperparameter to build the best model. I find the best hyperparameter by cross-validation. 

Lasso

I used a Lasso Regularization model to fit the train set with all features included. The optimal pruning parameters I got is 0.000193. Below is the performance with this best alpha value.


Ridge

Ridge is another regression model that pushes the coefficient close to 0. The best alpha after cross-validation is 0.1568. The result is a little better for training data but also a little worse for validation data.


Random Forest

Random forest is one of the most widely used models in the world. It allows missing value and categorical data as input.

As there are many parameters to set, we performed RandomizedSerchCV to randomize the selected parameter in a large range, then used the GridSearchCV to cross-validate all the parameter in a smaller range. The best hyperparameter is max_depth=100, max_features=2, min_sample_slipt=2, n_eatimator=600 and so on.


The average error is higher, and it take more time to train the data.

Below is a chart displace the importance of the features. Overall Quality, Ground Living Area and 1st Floor Surface area number is the top 3, which also shows very high correlation with sale price in the above correlation map.
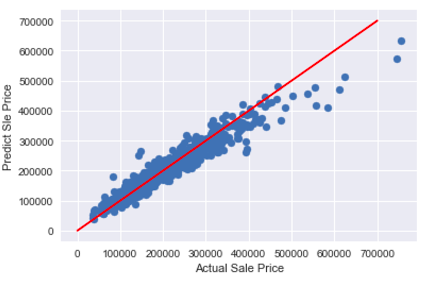
                                

XgBoost

Below is the performance for the XgBoost model. The model is a little better than other models but take longer time.


The feature importance chart shows the basement unfinished surface, lot area and 1st floor area is the top 3 importance features.


Stacking models

After all the models I have tried above, the final stage arrived. This is the part where I took the results to combine the predictive power of out models. I stacked the four models using the Xgboost model.


MSE for train data is: 0.002076

Above is the result of stacking models

Data Result

Kaggle calculated the score based on the prediction result I submitted. Below is a summary for all the RMSLE:

  • Lasso: 0.12153
  • Ridge: 0.12966
  • Random Forest: 0.17462
  • Xgboost: 0.1311
  • Stacking model: 0.14029

The Lasso model yielded the best prediction result, and Random Forest had the worst result. Although our training data fit very well for stacking model, it shows high RMSLE in the test data. This may be because the model is overfitted. The result is acceptable for a simple model prediction.

Conclusion

The house price prediction is a good practice to apply machine learning skills.  Further analysis can be applied to adopt in more models and better hyperparameter.


About Author

Shiyu Li

View all posts by Shiyu Li >

Leave a Comment

Cancel reply

You must be logged in to post a comment.

No comments found.

View Posts by Categories

All Posts 2399 posts
AI 7 posts
AI Agent 2 posts
AI-based hotel recommendation 1 posts
AIForGood 1 posts
Alumni 60 posts
Animated Maps 1 posts
APIs 41 posts
Artificial Intelligence 2 posts
AWS 13 posts
Banking 1 posts
Big Data 50 posts
Branch Analysis 1 posts
Capstone 206 posts
Career Education 7 posts
CLIP 1 posts
Community 72 posts
Congestion Zone 1 posts
Content Recommendation 1 posts
Cosine SImilarity 1 posts
Data Analysis 5 posts
Data Engineering 1 posts
Data Engineering 3 posts
Data Science 7 posts
Data Science News and Sharing 73 posts
Data Visualization 324 posts
Events 5 posts
Featured 37 posts
Function calling 1 posts
FutureTech 1 posts
Generative AI 5 posts
Hadoop 13 posts
Image Classification 1 posts
Innovation 2 posts
Kmeans Cluster 1 posts
LLM 6 posts
Machine Learning 364 posts
Marketing 1 posts
Meetup 144 posts
MLOPs 1 posts
Model Deployment 1 posts
Nagamas69 1 posts
NLP 1 posts
OpenAI 5 posts
OpenNYC Data 1 posts
pySpark 1 posts
Python 16 posts
Python 458 posts
Python data analysis 4 posts
Python Shiny 2 posts
R 404 posts
R Data Analysis 1 posts
R Shiny 560 posts
R Visualization 445 posts
RAG 1 posts
RoBERTa 1 posts
semantic rearch 2 posts
Spark 17 posts
SQL 1 posts
Streamlit 2 posts
Student Works 1687 posts
Tableau 12 posts
TensorFlow 3 posts
Traffic 1 posts
User Preference Modeling 1 posts
Vector database 2 posts
Web Scraping 483 posts
wukong138 1 posts

Our Recent Popular Posts

AI 4 AI: ChatGPT Unifies My Blog Posts
by Vinod Chugani
Dec 18, 2022
Meet Your Machine Learning Mentors: Kyle Gallatin
by Vivian Zhang
Nov 4, 2020
NICU Admissions and CCHD: Predicting Based on Data Analysis
by Paul Lee, Aron Berke, Bee Kim, Bettina Meier and Ira Villar
Jan 7, 2020

View Posts by Tags

#python #trainwithnycdsa 2019 2020 Revenue 3-points agriculture air quality airbnb airline alcohol Alex Baransky algorithm alumni Alumni Interview Alumni Reviews Alumni Spotlight alumni story Alumnus ames dataset ames housing dataset apartment rent API Application artist aws bank loans beautiful soup Best Bootcamp Best Data Science 2019 Best Data Science Bootcamp Best Data Science Bootcamp 2020 Best Ranked Big Data Book Launch Book-Signing bootcamp Bootcamp Alumni Bootcamp Prep boston safety Bundles cake recipe California Cancer Research capstone car price Career Career Day ChatGPT citibike classic cars classpass clustering Coding Course Demo Course Report covid 19 credit credit card crime frequency crops D3.js data data analysis Data Analyst data analytics data for tripadvisor reviews data science Data Science Academy Data Science Bootcamp Data science jobs Data Science Reviews Data Scientist Data Scientist Jobs data visualization database Deep Learning Demo Day Discount disney dplyr drug data e-commerce economy employee employee burnout employer networking environment feature engineering Finance Financial Data Science fitness studio Flask flight delay football gbm Get Hired ggplot2 googleVis H20 Hadoop hallmark holiday movie happiness healthcare frauds higgs boson Hiring hiring partner events Hiring Partners hotels housing housing data housing predictions housing price hy-vee Income industry Industry Experts Injuries Instructor Blog Instructor Interview insurance italki Job Job Placement Jobs Jon Krohn JP Morgan Chase Kaggle Kickstarter las vegas airport lasso regression Lead Data Scienctist Lead Data Scientist leaflet league linear regression Logistic Regression machine learning Maps market matplotlib Medical Research Meet the team meetup methal health miami beach movie music Napoli NBA netflix Networking neural network Neural networks New Courses NHL nlp NYC NYC Data Science nyc data science academy NYC Open Data nyc property NYCDSA NYCDSA Alumni Online Online Bootcamp Online Training Open Data painter pandas Part-time performance phoenix pollutants Portfolio Development precision measurement prediction Prework Programming public safety PwC python Python Data Analysis python machine learning python scrapy python web scraping python webscraping Python Workshop R R Data Analysis R language R Programming R Shiny r studio R Visualization R Workshop R-bloggers random forest Ranking recommendation recommendation system regression Remote remote data science bootcamp Scrapy scrapy visualization seaborn seafood type Selenium sentiment analysis sentiment classification Shiny Shiny Dashboard Spark Special Special Summer Sports statistics streaming Student Interview Student Showcase SVM Switchup Tableau teachers team team performance TensorFlow Testimonial tf-idf Top Data Science Bootcamp Top manufacturing companies Transfers tweets twitter videos visualization wallstreet wallstreetbets web scraping Weekend Course What to expect whiskey whiskeyadvocate wildfire word cloud word2vec XGBoost yelp youtube trending ZORI

NYC Data Science Academy

NYC Data Science Academy teaches data science, trains companies and their employees to better profit from data, excels at big data project consulting, and connects trained Data Scientists to our industry.

NYC Data Science Academy is licensed by New York State Education Department.

Get detailed curriculum information about our
amazing bootcamp!

Please enter a valid email address
Sign up completed. Thank you!

Offerings

  • HOME
  • DATA SCIENCE BOOTCAMP
  • ONLINE DATA SCIENCE BOOTCAMP
  • Professional Development Courses
  • CORPORATE OFFERINGS
  • HIRING PARTNERS
  • About

  • About Us
  • Alumni
  • Blog
  • FAQ
  • Contact Us
  • Refund Policy
  • Join Us
  • SOCIAL MEDIA

    © 2025 NYC Data Science Academy
    All rights reserved. | Site Map
    Privacy Policy | Terms of Service
    Bootcamp Application