Flight Delays in the COVID-19 Era: Insights from Top Carriers
The COVID-19 pandemic brought major disruption to many of our lives. Work and school became remote, supply chain issues arose, and multiple industries saw a dearth of demand. The travel industry was hit particularly hard as international travel became very difficult, and even domestic flights were rare. We sought to observe the five largest carriers and see which performed best during this period. By identifying the most efficient ones, we can look at their operations to inform future decision-making and strategic planning within the aviation industry.
The dataset can be obtained from the BTS (Bureau of Transportation Statistics) website. It covers the time period of 09/2007 - 08/2022. The dataset contains nearly 250,000 observations and features of year, month, carrier, airport, arrivals, arrival delays, and some other features splitting up arrival delays into specific contributions (e.g. weather, security, late aircraft in previous leg, etc.).
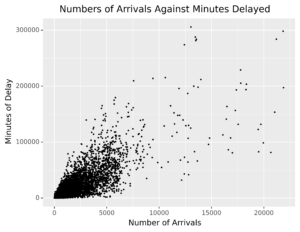
There is no specific date parameter in this dataset, so we have to analyze temporally by month-year. Below is a scatter plot to help visualize the distribution of arrival flights against minutes of delay. Each point represents a different pair of carrier and airport values at a specific month-year. There is a somewhat conical shape to the distribution.

When comparing different airlines, the number of arrivals differ. Thus, in order to compare different airlines, we look at an engineered feature instead: the average minutes of delay per flight. Via this metric, let’s first see what happened to the average minutes delayed during the pandemic. At the initial onset, there is a large drop in average minutes delayed. It’s not until partway through 2021 that efficiency falls to the prior levels, likely due to increased demand related to summer travel and vaccine acceptance.

The average flight delay drops at the onset of the pandemic and slowly rises until the middle of 2021. This indicates that customers were, in general, facing fewer delays during this time period. This makes sense as logistics often get a bit easier at a smaller scale.
The five airline carriers with the most arrival flights were American Airlines (AA), Delta Airlines (DL), SkyWest Airlines (OO), United Airlines (UN), and Southwest Airlines (WN).

Looking at their performance over time, we see that Southwestern Airlines was frequently the most efficient of these airlines. However, Delta Airlines was able to maintain a fairly low average minutes delayed, while Southwestern Airlines jumped around more as flight demand increased. This suggests that Delta Airlines had a system in place that was scalable and ready to adjust to an increase in demand, which Southwestern lacked.

This exploratory analysis of airline carriers during the COVID-19 pandemic grants insight into the adaptability and resilience of their operations. The aviation industry has largely recovered by now. However, in the event of another pandemic, we should learn from the example of Southwestern to strip back operations while maintaining high efficiency and from Delta to scale-up operations once demand increases. If we can properly extract the principles which permitted these, we may be able to build robust systems that can be applied to industries outside of aviation, as well. Robustness allows our systems to withstand fluctuations and shocks, benefiting both the systems themselves and the people who use them.

