A Data Analysis of Missed NBA Games
The skills the author demoed here can be learned through taking Data Science with Machine Learning bootcamp with NYC Data Science Academy.
Over the last few years, injuries and missed games in the NBA have been a dominating topic and a concerning matter for the league. Missing games due to an injury hurts a player’s market value and hinders his team’s ability to win and turn a profit as a business. An improved understanding of missed games can help a player prolong his career and earn more money and can help a team scout, draft, train, trade and pay their players appropriately. For this project, I chose to explore the data on the possible causes and financial affects of missed games by NBA players over the last 20 seasons.
Through my analysis I set out to explore if the narrative is true that taller and heavier players get injured more. Additionally, does an increase in minutes increase a players chances of getting injured? What correlation exists between a player’s salary and missed games? And finally, which teams have lost the most money due to missed games by their players?
The Data
Using Scrapy, I scraped data from BasketballReference.com, RealGM.com, HoopsHype.com, and Wikipedia. My dataset included over 7,000 rows of data, which consisted of:
- Season
- Player Name
- Team
- Height
- Weight
- Minutes Per Game
- Salary
- Salary Per Game
- Games Played
- Games Missed
- Percentage of Games Missed
I used percentage of games missed for the majority of my analysis to account for the 1998-1999 and 2011-2012 seasons, when each team only played 50 and 66 games, respectively, as opposed to the standard 82.
Height, Weight and Minutes Per Game
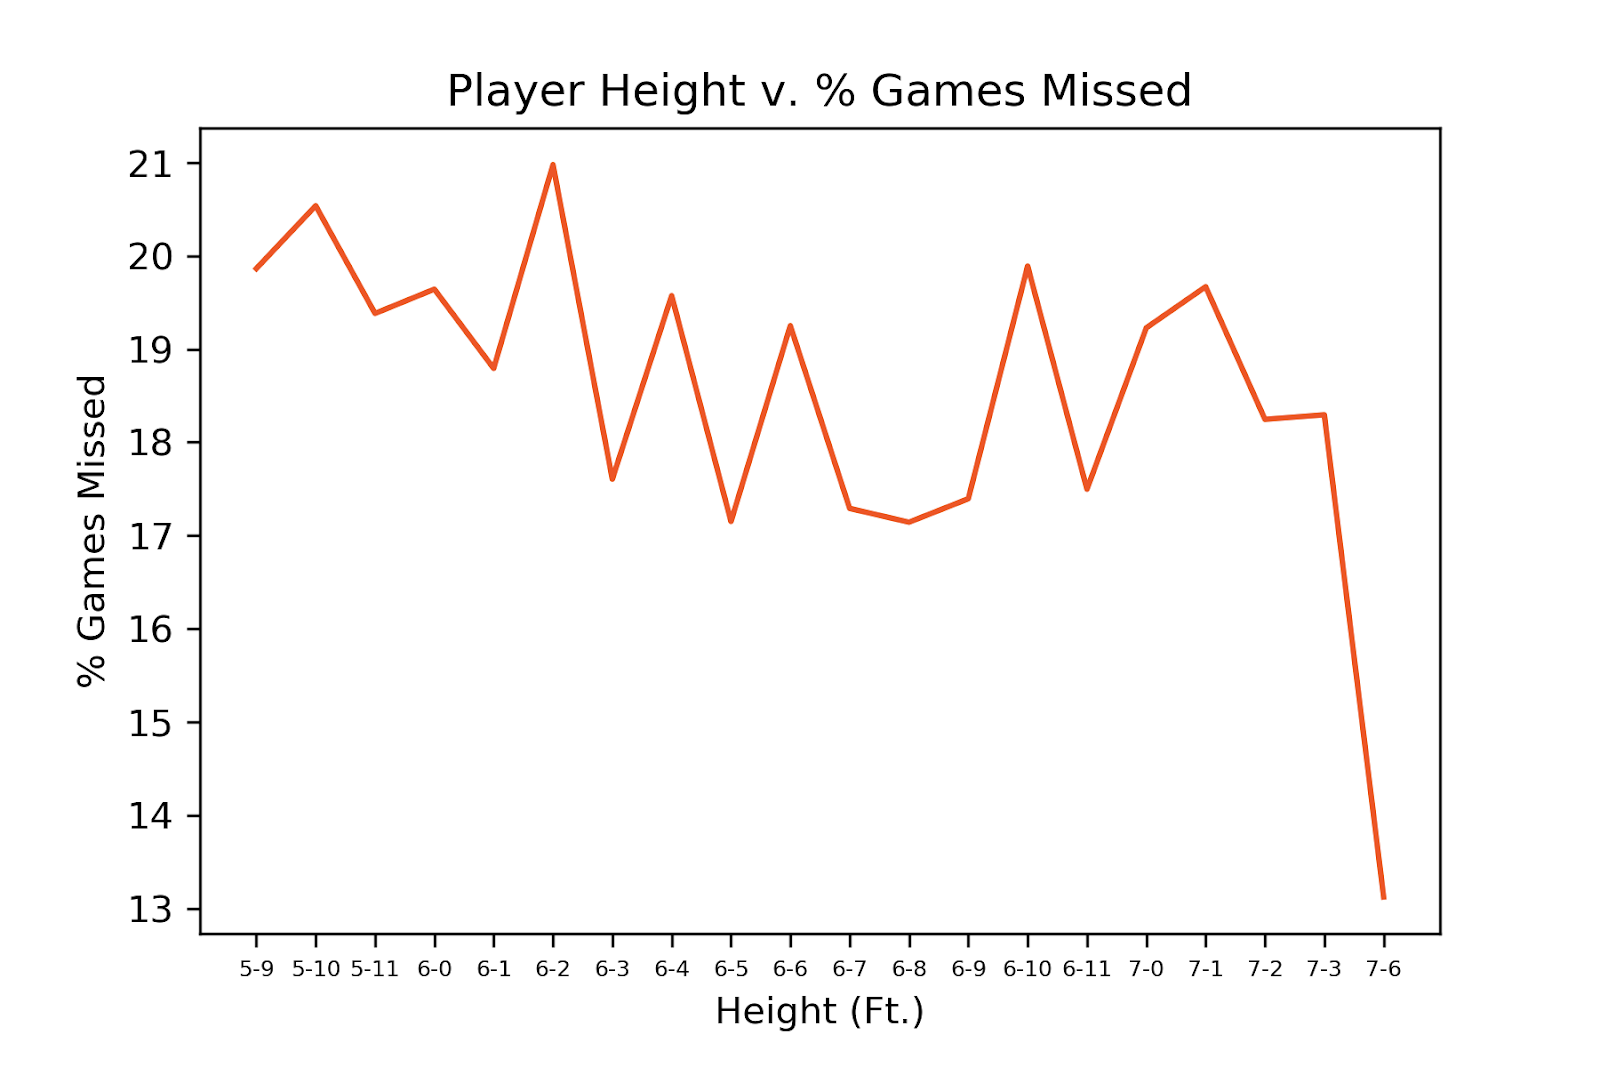
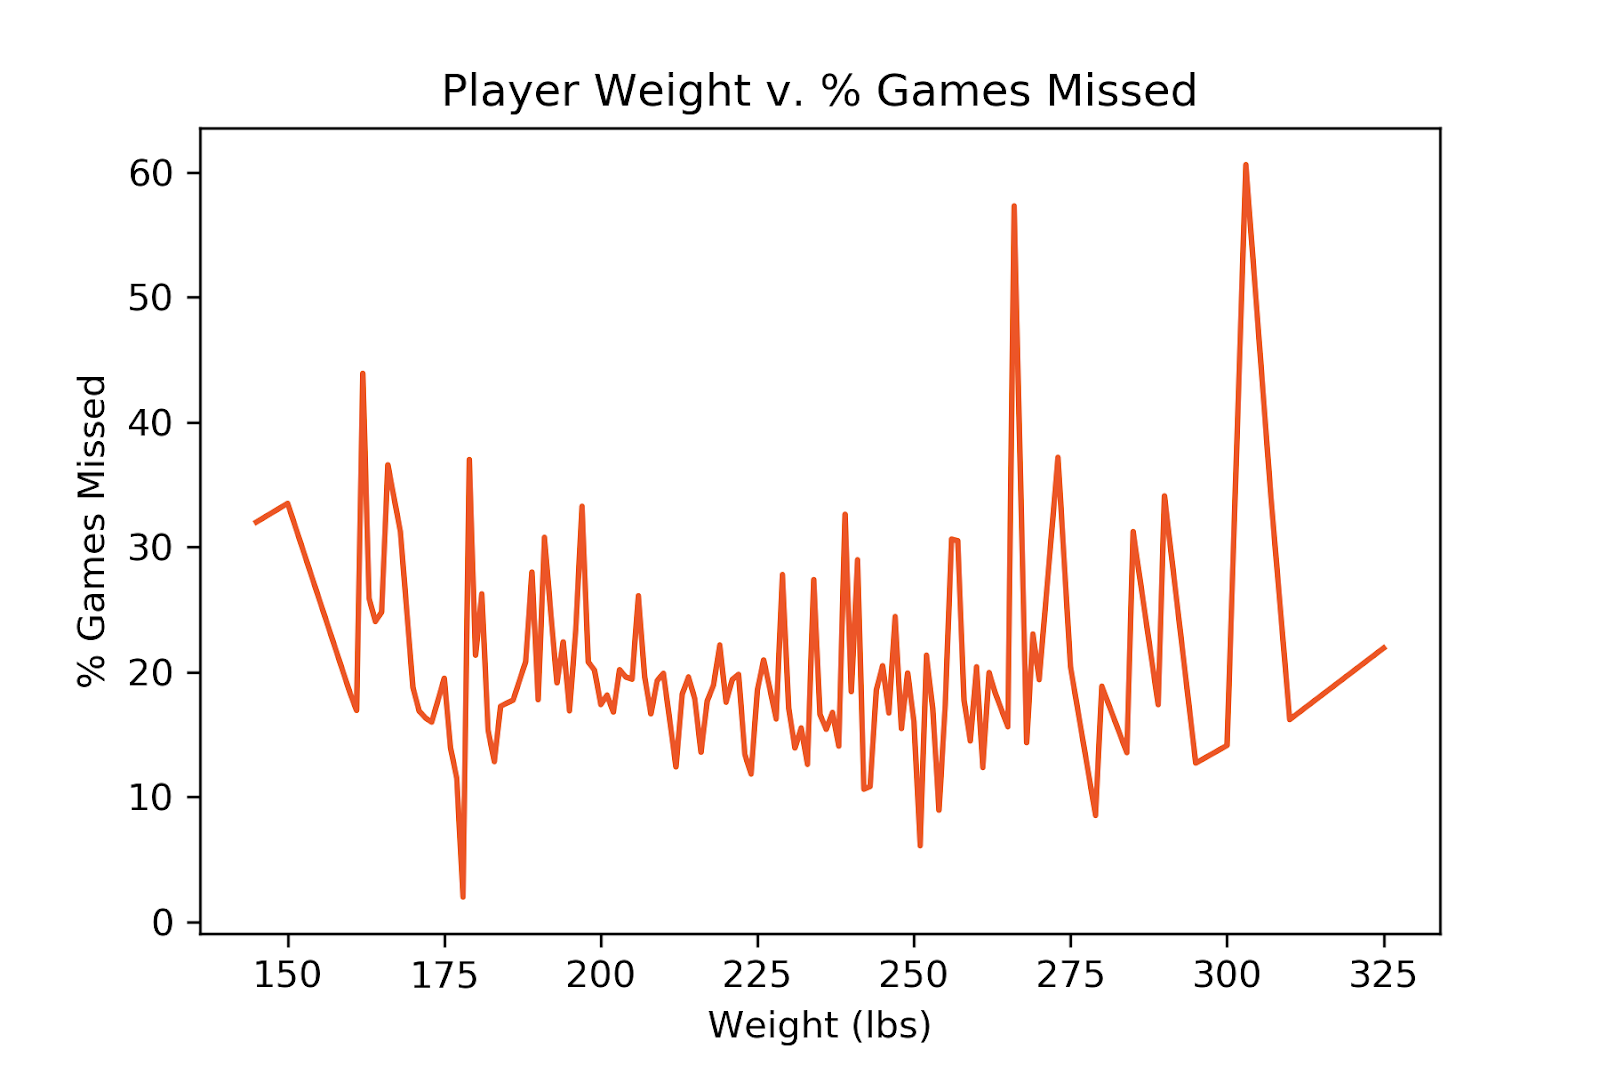
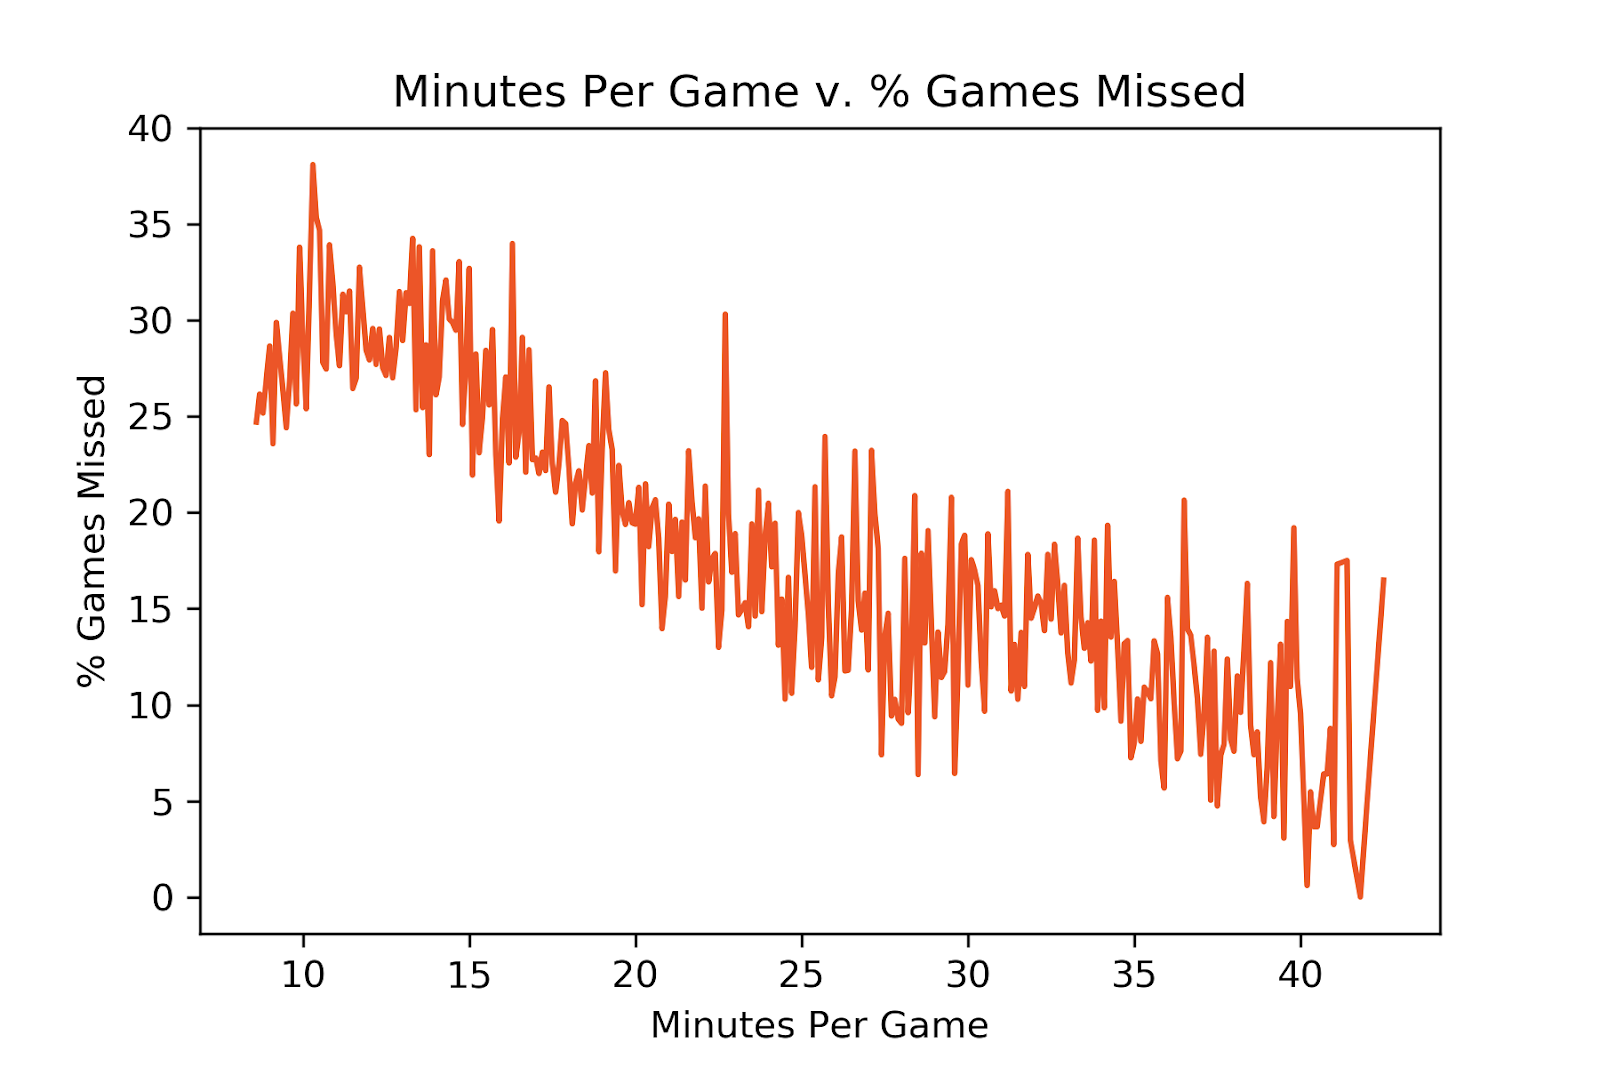
The average NBA player misses 18% of his games throughout his career. When looking at player height, there was no correlation to percentage of games missed. Players 7’6” tall have historically only missed 13% of their games in the last 20 seasons, but there have only been 12 such players, too small a sample size to draw a conclusion. Player weight does not reveal any correlation to games missed either. There is a spike at 260 and 310 pounds, however, there are only seven players at each of these weights, not enough for a verdict. For minutes played, we see that as minutes per game increases, percentage of games missed decreases.
This is somewhat surprising, since one might assume that the more you play the more you increase your chance of injury. A possible explanation could be that players that play more minutes are in better shape, which reduces their risk of injury, and players that play less are in worse shape, increasing their risk of injury. This area needs more research, such as minutes spent training, and minutes by height and weight, before drawing a conclusion.
Data on Games Missed Per Season
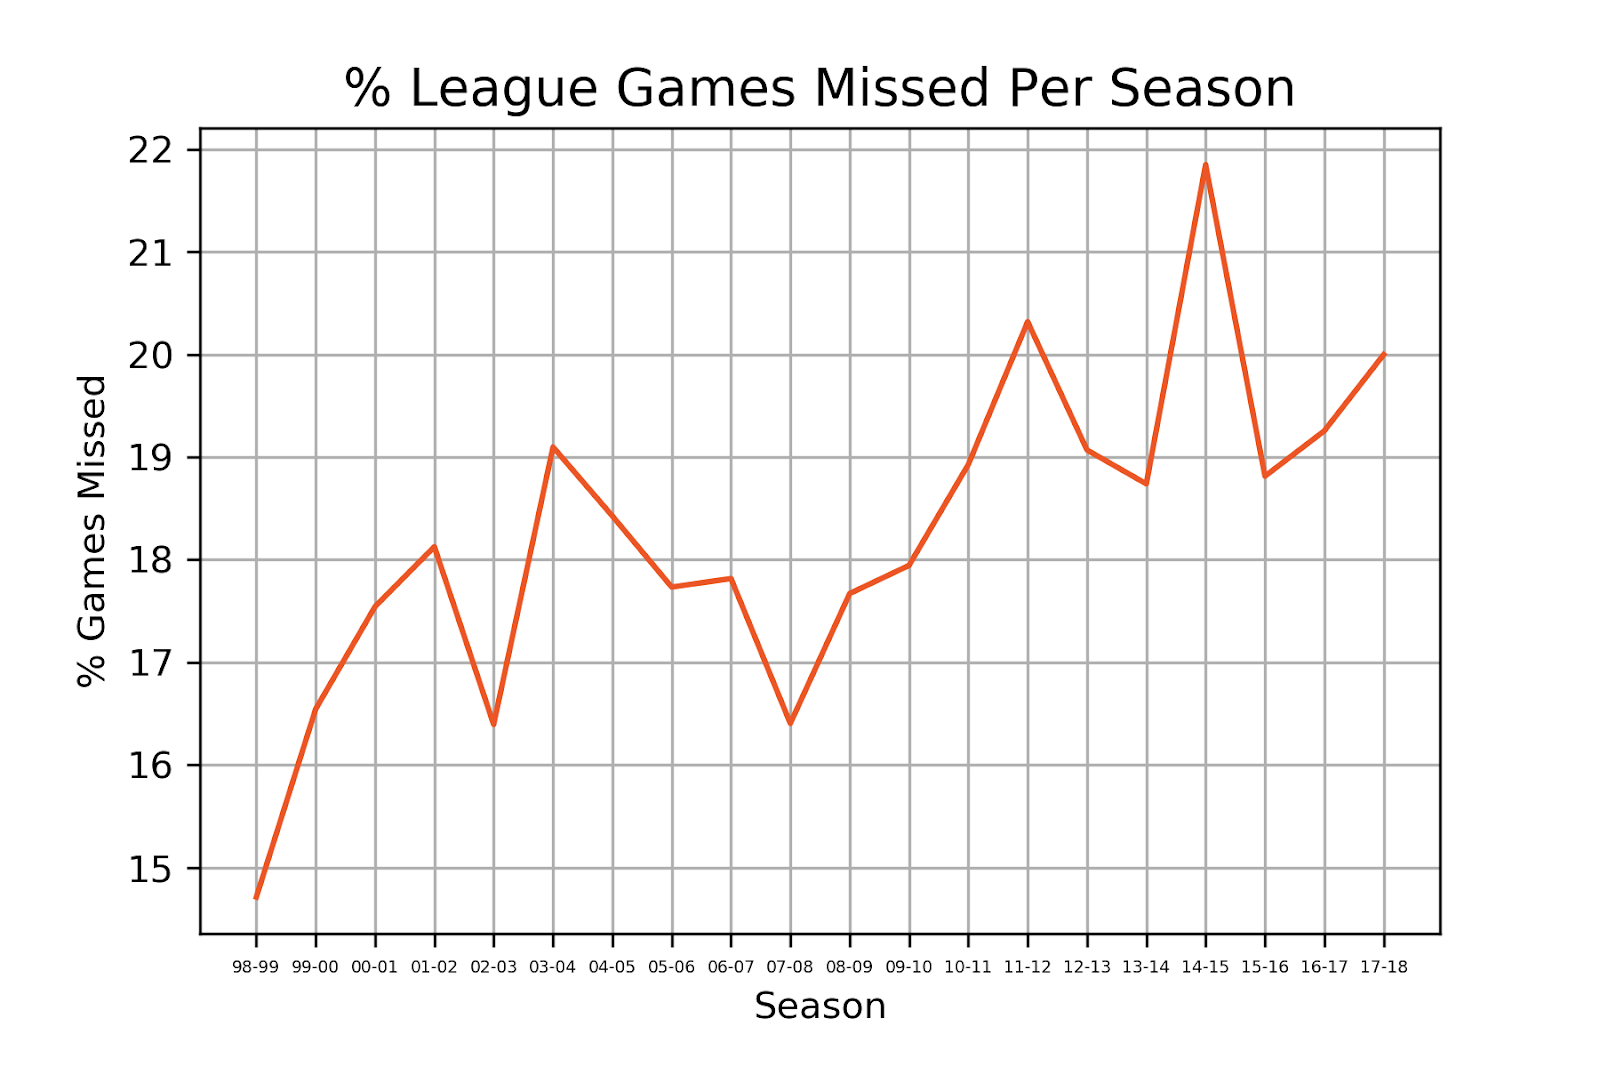
When analyzing the average percentage of games missed per player per season we see that injuries have been increasing over the last 20 seasons, confirming recent league wide concern. Last season, players missed 5% more games than players in the 1998-1999 season, which is about 4 more games per player on average, for an 82 game season. The reason behind this trend has been thought to be from an increase in pace and athleticism.
There was a significant spike in the 2014-2015 season. This was most likely just random bad luck, due to players like Joel Embiid, Paul George and Steve Nash all missing the entire season due to injury and Julius Randle having a season ending injury in his first NBA game.
Data on the Money Lost to Games Missed

Finally, I compared the total games missed and money lost to games missed by every team over the last 20 seasons. The formula for money lost to games missed is: salary per game * games missed. The data shows that the New York Knicks have lost the most money to games missed ($250mm), the Miami Heat's players have missed the most amount of games and the Oklahoma City Thunder have lost the least amount of money to injured players and their players have missed the least amount of games.
Inherently, large market teams like New York, Miami and Boston will be at a greater risk of losing more money to missed games since they have more money to pay their players and therefore a missed game by a player will cost more. The opposite is true for smaller market teams.
Conclusion
The data analysis from this web scraping data reveals no correlation between player height or player weight and games missed. This directly contradicts a common sentiment that taller and bigger players miss more games. The analysis also shows a correlation between an increase in minutes and decrease in games missed, however, more work needs to be done before drawing any conclusions. The data supported the concern that player injury has increased over the last few years. Finally, larger market teams, while holding a financial advantage over smaller markets, are at a greater risk of losing more money to injured players.
Further analysis could look at data beyond the last 20 seasons, as well as statistics on player age, years in the league, player height by each weight and player weight by each height. The data could also be used to predict future games missed by a player based on certain characteristics.
Code
The web scraping was done using Scrapy and the analysis was done using Python. All data and analysis is on my GitHub.