Data Analysis: Bluebonnet Data Recruiting and Training
The skills I demoed here can be learned through taking Data Science with Machine Learning bootcamp with NYC Data Science Academy.
By Devin Fagan, Chase Rendall, and David Zask.
Please find the Github to the project here. Presentation slides here.
Background
Bluebonnet Data recruits and trains data scientists to work on down-ballot candidates’ campaigns through their fellowship program. Fellows are trained on how to apply their technical skills, calculate a winning number, and create a data-driven campaign strategy for a successful campaign. Bluebonnet Data supports Democrat candidates and focuses on local elections.
Objective
For this corporate capstone project and in order to best allocate resources, our goal was to inform Bluebonnet Data which congressional districts have the best chances of electing one of their candidates. Our goals were to create an unsupervised model identifying the similarities between congressional districts and to identify the most impactful demographic features that can be used to predict which districts will have similar voting patterns.
The Data
In order to create a dataset from which to build our model, we sourced information from the US Census and the MIT Election Lab. The census data included 435 rows and 300 variables. Out of these variables we chose 68 variables. 21 were demographic, such as age and ethnicity; 31 were economic, i.e. median income; and 16 were social and included factors such as method of transportation. The election data initially included 29,000 rows and 7 variables. Both of these data sets were reduced to three years: 2014, 2016, and 2018, the last three years that included a congressional election.
Data Preparation and EDA
From this particular dataset, we decided to aggregate columns such as income and age. For income, we aggregated income levels; $25,000 and under for poverty, $25,000 - $50,000 for low income, and so on. Also aggregated age for validity. We wanted to keep the data as close to the organization of polling and census data as possible. Dropped columns that seemed to be redundant, such as “no healthcare” and “healthcare” columns.
For feature engineering, we also created two new columns which ended up being our target variables for the supervised learning models. The “Percent Won” column was created by dividing the total votes received by the winning candidate by the total votes of the election.
Creating Column
From there we created the “Dem Percent” column by taking the “Percent Won” column and subtracting all of the Republican districts that won from 1. For example, if a Republican won by 95% the percent of Democratic votes would be 5%. Once we feature engineered these two new columns, we decided to run Exploratory Data Analysis.
We ran a collective of feature correlations and pairwise scatterplots to find the most correlated features.

As seen in the diagram above, we ran pairwise scatterplots against the “Percent Won” column and other features. The variable did find some correlations, however, most of them were not statistically significant.

Again, seen in the diagram above we also found some of the correlations to have a high negative correlation with come of the features. Our dataset consisted of 1305 rows and 52 features. At this point, we felt as though our dataset and our feature selection could still be improved. To resolve this issue, we looked toward PCA and supervised modeling.
PCA
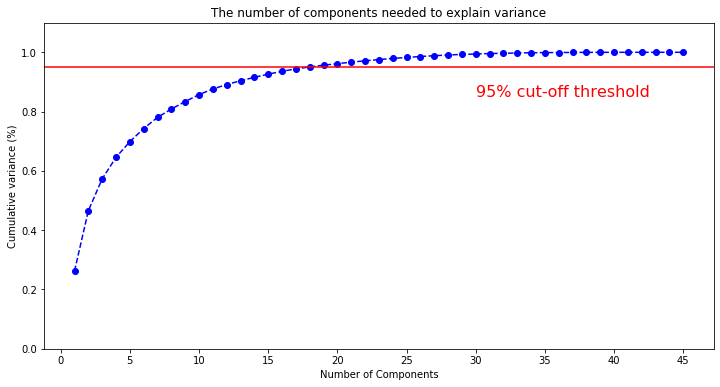
In order to decrease the number of dimensions of our model to avoid sparsity, we implemented a Principal Component Analysis (PCA). PCA simplifies the features into principal components, which are influenced by a different combination of dimensions.
Each of these components explains a certain amount of the variance of the data. In our model, we decided to choose the number of variables that were necessary to explain 95 percent of the variance of the data. You can see in the graph below that this occurs at 18 principal components. Through PCA we were able to go from 45 dimensions to 18, which greatly improved our model performance.
As you can see the first principal component explains the largest amount of the variance compared to the subsequent components. Therefore, the first principal component will be the most represented in our model. We analyzed the magnitude of the different features that were captured in the first component.
The chart below visualizes the top 20 features that contributed the most to the first principal component. The first PC is a composite of all these features. This also means that these features are likely to explain most of the variance in our model and are thereby the most significant.

Principal Component Regression Model
Before looking at clustering, we first wanted to create a regression model to get a sense of which features were most related to the percent win of a Democratic candidate in a congressional district. Since many of our features had high multicollinearity, a natural solution was to use the principal components for the regression. We used 45 numerical features from the Census data and reduced them to 18 principal components, explaining 95% of the total variance.
Using the percentage of votes a Democrat candidate received in a district as our target, we obtained an R^2 value of 0.568. The fact that we did not obtain a higher R^2 value likely is an indication that only so much of the variance of Democrat voting percentage can be explained by Census data alone, while many important factors, such as the candidate, current social issues, or current president, also play a large role.

After performing principal component regression, we then considered other supervised tests with the data and if further feature elimination was possible.
Logistic Regression and Recursive Feature Elimination
We ran a Logistic Regression to determine whether our data could be used to predict which party would win the election. Running the regression on all of the features gave us an R-squared of 0.56 and the confusion matrix below. This model correctly predicted 86 percent of Republican victories in the test set and 91 percent of Democrat victories. Its overall accuracy was 89 percent.
|
Predict R |
Predict D |
|
|
Actual R |
160 |
25 |
|
Actual D |
17 |
179 |
Unreduced model
The unreduced model performed well but we wanted to see if we could use a model that had fewer features and performed comparably or even better. We used a method called Recursive Feature Elimination with Cross-Validation, which ranks the features by importance and removes the least important features in order to determine which number of features leads to the best performing classification model.
As you can see in the graph below the performance of the model peaks at 21 features. The Top 10 most important features according to this method were: home language not English(D), Median Household Income(D), Percent Car(R), 200k+ income(R), non-family household(D), Service(D), Bachelors or higher(D), Black Pct(D), production transportation and material moving(D), No Health Insurance(R). You can see some overlap with the PCA, but there is little to no multicollinearity in these features because this is a linear model.

We then ran the logistic regression only using the specified features and our model performance improved. We got an R-squared value of 0.63 and the confusion matrix below. The reduced model correctly guessed 89 percent of Republican winners and 93 percent of Democrat winners. Its overall accuracy was 91 percent.
|
PredictR |
PredictD |
|
|
ActualR |
164 |
21 |
|
ActualD |
14 |
182 |
Reduced Model
We then used the reduced model to predict the results of the uncontested elections, which we excluded from our model. In doing so we found 5 districts that could be flipped from Republican to Democrat according to our model. This is a list of the districts on some key characteristics:
FL-24: Median Income = 44k, NotEnglish = 76.6%, Hispanic: 76%
GA-11: Median Income = 66k, Bachelors or Higher: 39%, Black: 18%
NC-3: Black_Pct = 20%, Median Income: 50k, 200k or more: 2.7%
PA-15: Production/Transport = 15%, Income = 60k, 200k+ : 4.5%
PA-18: Income = 64k, Bachelors +: 37%, No Health Insurance: 3%
The uncontested districts that could be flipped were fairly diverse and we could identify some important features from our model that might have led to the Dem prediction. Generally speaking an above-average median income with less wealth inequality and/or a high minority population will make a district sway democrat.
The Logistic Regression model was quite insightful as it allowed us to use our model to make and verify predictions. It also allowed us to remove features and evaluate model performance in order to determine which features were important in determining voter behavior. The PCA does this as well, but the most optimal model would likely use Feature Elimination followed by PCA in order to minimize dimensionality and improve accuracy and clarity.
K-Means
We selected k-means clustering as our final clustering technique due to its simplicity and the fact that scikit-learn offers a predict method, which allowed us to use congressional data from 2014 and 2016 to generate the cluster centroids and then use the 2018 congressional data to predict on it.
One issue when using k-means clustering is the fact that the number of clusters must be input by hand before running the algorithm. We used silhouette scores as a way to quantify how many clusters to choose. Our silhouette scores remained roughly around 0.25 for cluster sizes of two to four but dropped significantly after that, so we settled on four clusters.

Using the 2014 and 2016 data, we then determined positions for the cluster centroids and predicted the clusters for the 2018 data.

2014 and 2016 clustering data
By visual inspection of the clusters, a few observations are apparent. In the purple cluster, Republican districts have the highest concentration, with some minority overlapping of Democratic districts. While there is some mixing of Democratic and Republican districts in the yellow cluster, for the most part, the Republican districts remain more tightly clustered in the bottom left and the Democratic districts are less centralized.
This makes sense, as the variance of many of the Census columns tends to be greater in the Democratic districts compared to the Republican districts and Democratic voters generally are a more diverse group compared to Republican voters as a whole.
Data Analysis
Interestingly, the brown and green clusters represent a splitting of many heavily Democratic voting districts, but with a differing demographic makeup. The brown cluster has many districts that lean more towards higher education and income while being less diverse ethnically. The green cluster represents more urban, working-class districts, which tend to have larger immigrant populations and less income. This is an example of how different demographic makeup can lead to similar voting outcomes in many Democratic districts.
After we obtained our final cluster result, we then checked the cluster centroids to see which principal components had the greatest influence within each cluster. Purple cluster, cluster zero, consisted heavily of Republican districts, which we note by the large negative influence of the first principal component.
Green cluster, cluster one, was influenced mostly positively from principal components one and two. Yellow cluster, cluster two, which had a large mix of Republican and Democratic districts, had influence from the first and second components. Brown cluster, which consisted mostly of higher-income Democratic districts, had a large influence from components two and three.


Principal component
Looking into which features played a role in each principal component, we saw a few consistent trends. Since the first principal component contains much of our variance, the features on the left, which correspond to negative values, play a larger role in many Republican districts. Having a lower income, less education, and a large percentage of white residents play a role in many of the Republican-leaning districts.
In comparison, on the right-hand side, we see that important features in Democrat-leaning districts are somewhat divergent, as confirmed by the brown and green clusters. Features related to high income and education are important in many Democrat districts, while features related to lower-income and lower education also contribute significantly to certain Democrat districts.
Many of America’s large cities tend to have dominant Democratic inner regions, which are often composed of a mixture of both wealthy and poor neighborhoods, and typically have a larger foreign-born presence compared to smaller, more rural towns.


