Leasing Warehouse: Corporation Supply Chain Demand PostCovid
The skills I demoed here can be learned through taking Data Science with Machine Learning bootcamp with NYC Data Science Academy.
\

As our nation recovers from quarantine, many industries are reevaluating their supply chains. Chains once thought to be highly optimized and streamlined to the global flow of goods. They have been crippled if not killed by the cascade of shutdowns instituted by municipal, state, and federal governments of nations all over the world. In this climate, the projections made last year about expected inventory or demand, or any other metric are out the window.
Corporations and their associated supply chains now float in stormy waters. The question then arises, what can be done? One of the best ways to adjust for uncertainty in supply chains is to catch a trend that's already been accelerating in industrial real estate for the past five years: leasing.
Leasing, a strategy Amazon pioneered, allows a company to be in more spaces faster and without an associated long term commitment. Flexibility is built-in. Resources can now be invested elsewhere, allowing a company to shift accordingly. But how does a company choose a good location? The costs associated with any given location are usually broken into three chunks:
- Cost of Storage (rent)
- Transport Costs (cost of getting good X from A to B, C, and D)
- Inventory Holding Costs (cost of unsold inventory)
Leasing Data
Absent detailed data on particular inventories and business models, I attempt to answer the first two with data I pulled from Loopnet.com.
Loopnet is a national listing site for commercial and industrial property. Listings are organized by city and state. The information on each page is submitted by realtors in a somewhat inconsistent fashion. As various important features of a property can be in different sections from listing to listing.
Each listing also has a section for nearby transport links - which usually consist of important supply chain hubs that a company would consider when leasing a property: nearby airports, railroads, freight ports, etc. I aggregated this information to assign a mean "connectivity" score for each city. Absent specific knowledge of a city's (or town's) traffic patterns, this gave me a good handle on how connected a given location was to the wider American trade network.
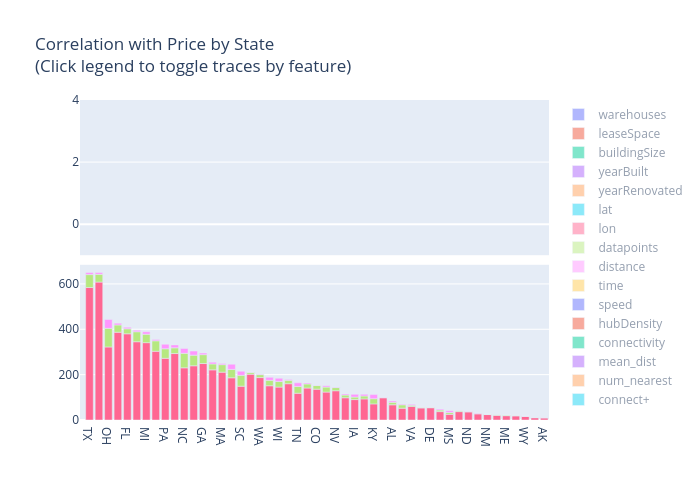
Here are six states with their connectivity scores for all cities:
 Overall, the connectivity metric proved to be the feature most correlated with the price per sq ft of the lease space. The predictive strength of the metric varied from state to state, with highest among New York, Florida, and Delaware and no correlation in Texas or Connecticut.
Leasing and Pricing
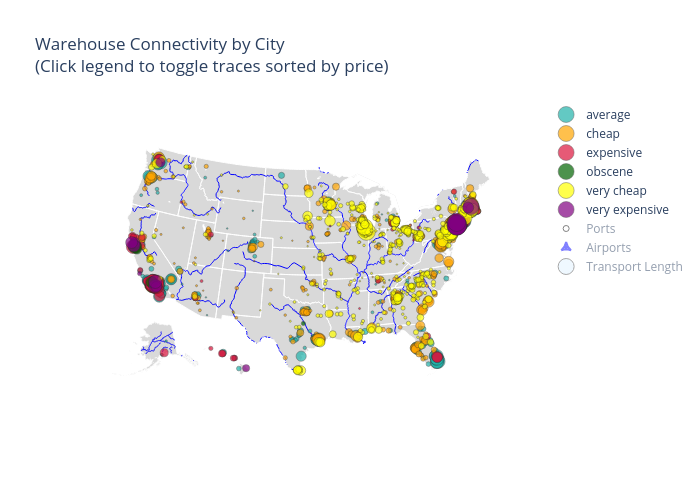
It goes without saying that national warehouse pricing isn't set or influenced by any single factor alone - but is a result of local demand, geography, and historical industrial developments. A good warehouse for an Iowa corn farmer doesn't need close access to several freight ports. But a warehouse in NYC does for companies intent on international distribution.
Absent any hard and fast rules, I created this visualization of the distribution of warehouses in the US, along with several averaged parameters that might aid in supply chain analysis.