Analyzing Data to Predict Home Prices in Ames, IA
The skills I demoed here can be learned through taking Data Science with Machine Learning bootcamp with NYC Data Science Academy.
Project Github| Aditya's LinkedIn | Ryan's LinkedIn| Gabby's LinkedIn
Introduction:
For this project, we took on the role of Data Scientists hired by Zillow Offers to create a pricing model for homes in Ames, Iowa. Using data on over 2,500 home sales between 2006 - 2010, it was our responsibility to thoroughly clean and analyze this data, and then create machine learning models to accurately price homes and answer questions about the real estate market in Ames. We implemented both supervised and unsupervised ML methods to predict housing prices and to create a handbook of data-driven insights for use by Zillow-affiliated real estate agents.
Business Angle:
Zillow Offers is an instant buying service provided to individual homeowners. Simply fill out a short online form about your home and Zillow will send an offer to purchase in just two business days, contingent upon an inspection. You don't have to show your home, don't have to prep it for sale, can set your own move-out date, and have surety of payment.
Also, if you choose not to sell your home to Zillow you can list it on the open market through a Zillow Premier Agent. Zillow views its Offers segment as a service to home sellers and as a way to drive volume into Zillow's other businesses. Offers run at 'razor-thin' margins, with a 2019 analysis of instant home buyers showing an average profit over cost of renovations of just 1.3%. Zillow Offers bought 4,162 homes in 2020 and is currently available in 25 metro areas across the country.
Zillow specifically cites its "superior data science and technology" as a competitive advantage, making this business angle chosen for our project particularly relevant. We decided to tackle two significant business problems for Zillow Offers as it hypothetically expands into Ames, Iowa; accurately predicting home prices and maintaining positive relations with the existing real estate industry in the area. The second point can be particularly difficult for Zillow as it continues to make inroads into the home buying industry.
To provide incentive for real estate agents to work with Zillow rather than isolate the company, we will assemble a handbook for Zillow Premier Agents that provides useful data-driven insights into the local housing market in Ames, Iowa. This information will help agents provide more value to their clients and encourage them to work with Zillow, not against it.
Data on Feature Engineering:
In order to proceed with modeling, the data needed to be cleaned and transformed. We used a combination of domain knowledge (for example, when combining classes of exterior coverings of similar value) and statistical tests (such as t-tests and chi-squared tests) to condense and simplify our dataset while retaining useful information.
Through the process of dummification and binarization, we were able to create interpretable datasets for our machine learning models. Some features were transformed to show slightly different information, such as combining separate porch type features into a binary feature for whether a home has a porch or not.
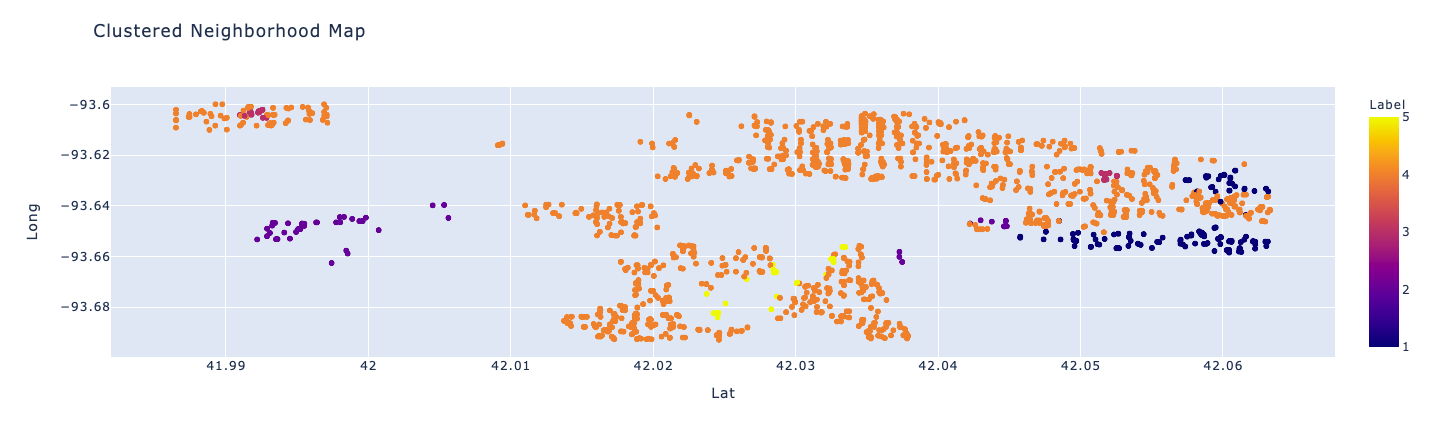
Neighborhood Clustering
Neighborhood Clustering: Another feature we engineered was created by performing hierarchical clustering on the Neighborhood feature of our original data. This column originally consisted of almost 30 unique values, most of which were sparsely represented.
Though we thought the neighborhood of a house would be important in its sale price, we wanted to narrow the column down to the most informative neighborhoods to minimize the number of columns when dummified while maintaining as much information as possible.
To do so, we clustered on each neighborhood in the test data as an instance on the following attributes: gross living area, year built, school district, sale price and distance from campus. In doing so we identified three unique clusters. We assigned these cluster labels to our data and used them in our modeling process.
Row Selection
Row Selection: Our business angle was kept in mind at all times as we went through the process of cleaning our data. Since our model is used to predict the prices of homes in Ames, Iowa for Zillow Offers, we wanted to (1) stick to the type of property Zillow would potentially provide offers for, and (2) narrow the ranges of key features in our model to values we have pricing data for.
Examples of our row filtering included limiting the model’s use to homes below 3,000sqft (there were very few homes larger than this) and dropping homes with poor overall conditions as Zillow is not in the business of flipping/renovating homes. We also dropped home sale records that didn’t represent normal open-market transactions, such as foreclosure sales.
Data on Our Models:
The machine learning models we implemented to predict sale prices were penalized and stepwise regression, random forest, and support vector regressor. Feature selection was extremely important in creating a properly fit model as we had over 100 attributes after dummifying necessary columns and implementing our initial feature screening process. Our original thought was to use lasso regression to help prune our 100+ columns to the most important ones and limit variance inflation and multicollinearity.
The lasso penalized linear regression model narrowed our feature count down to 69 and scored a test R2 of 92%. We also tried stepwise regression, implemented in R, which ultimately became our preferred model due to its simplicity and interpretability. This model used only 31 features and had a comparable R2 of 91%, without significant multicollinearity concerns (as measured by coefficient VIF’s).
In addition, a random forest non-linear model was run which used 86 features and had an R2 of 90%. Support Vector Regression was also tried. It performed worse than the null model with the default RBF kernel, but performed well using a linear kernel with an R2 score of 95%. We, however, opted for the more interpretable linear regression model given its similar R2 performance.

Pricing Model:
For our pricing model we chose a simple linear regression with 31 features determined through stepwise feature selection. This model exhibited similar predictive metrics as more complex models, while maintaining the interpretability of its calculations.
The features used in the model, and their coefficients, can be found in the accompanying table. Unsurprisingly, we found the most important features to be the size of the house, its age, and its overall quality. A surprising find was that our model did not select to use the number of bathrooms in a house as a feature. When we added this feature back to the model, it increased multicollinearity between features while adding no predictive power. This signals that the number of bathrooms in a house in Ames can generally be predicted based on the features already used in the model, including size and age of the home.
Running our test data set through the pricing model resulted in an R2 of 92% and a residual standard error of $19,390. While this error is large compared to the estimated average profit per house of 1.3% for instant homebuying programs, we assume this adds variance to our per-home profit and that it does not result in systematic mispricing. Future collection of more home sale records in Ames would reduce our residual standard error further, resulting in a more accurate model.
Data Driven Handbook of Insights:
With the pricing model completed, it was time to turn our attention to building a handbook of data-driven insights for use by Zillow-affiliated real estate agents. We investigated several interesting questions and used our models to provide answers for our agents.
Kitchen
Kitchen Renovations: Kitchens are very expensive to remodel, with online sources indicating a midrange kitchen renovation often totals $40,000 - $50,000. Through interpretation of our machine learning model, we found that homes in Ames with excellent kitchens command just a $24,300 premium.
Since it is cheaper to buy a home with a high-quality kitchen than to upgrade one post-purchase, buyers looking for excellent-quality kitchens should purchase a home with one rather than planning a remodel, and sellers should avoid doing full kitchen renovations as they are unlikely to recoup their investment.
Asbestos Shingles
Asbestos Shingles: Asbestos was a widely used house exterior material until the 1970's when it was banned. The negative health effects of asbestos are widely known yet many homes still have their original asbestos exteriors. It is not a serious health issue until the asbestos becomes cracked and worn and fibers become airborne, but the shingles will eventually need to be replaced. It is an expensive process requiring special safety gear and permitting.
Our model indicates a $13,400 hit to home resale value from having asbestos shingles rather than more typical vinyl siding or plywood covering. The cost to both dispose of and replace asbestos with another exterior material is likely to be significantly higher than this, so we recommend that buyers avoid homes with asbestos siding and that sellers forego replacing it and sell their home as-is.
Bathrooms
Bathrooms: Available online sources indicate that the cost of adding a new bathroom to a home averages $10,000. Given that our pricing algorithm does not increase in accuracy when including bathroom count, it is not recommended that sellers add to the bathroom count of their home. It is, however, recommended that buyers make sure to purchase a home with the number of bathrooms they desire. Money invested in adding bathrooms after purchase is unlikely to be recouped at a future sale of the home.
Remodeling
Remodeling: Another question we explored was how much discrepancy exists in the sale price of remodeled and unremodeled houses of the same year. To answer this, we isolated the years in our data that had a sufficient split between both types, 1950-1999, and split the data into remodeled and unremodeled houses.
We performed a simple linear regression on each dataset to isolate the base price and the effect of year built on the sale price. We found that a remodeled home built in 1950 sells for about $20,000 more than its unremodeled counterpart. In addition, the effect of age on the home values of both remodeled and unremodeled homes is roughly the same.
Data on Sale Comps
Automatic Sales Comps: As a real estate agent, much time is spent gathering sales comps of properties being sold. We decided to automate this process by using K-Nearest Neighbor on our data set. The real estate agent can input housing features like gross living area, lot area, year built, and more and get a list of comparable properties and their sales price within a specified distance.
This was not built specifically for predicting sale price of the inputted house with KNN because we already had a robust, interpretable model that performed well, however, this can save real estate agents time and give them insight into similar properties in the neighborhood.
Future Work:
Given the timeframe and resources we had for this assignment, there were certain elements that left us restricted. For example, machine learning models perform better the more high-quality data they have as inputs. With much more data, we would likely achieve higher performance from our models, and could even potentially use more complicated models.
A future path of investigation would be to source more data for our model training. We could use the value of the Case-Shiller HPI to adjust sales prices to a reference year of our choosing, allowing us to use more data while minimizing the error introduced by using home sales prices at different points in time.
Another limiting element was domain knowledge. With no prior knowledge of real estate markets, we were left vulnerable in certain aspects. For example, initially, our highest scoring feature importance in all our models was ‘Lnd_AcS’, a column that we had no knowledge of and was not included in the reference data dictionary.
For this reason, we had to drop the feature entirely but with more knowledge, we may be able to find better results in our modeling with it included. Interviewing real estate agents and home inspectors would increase our understanding of the data we have and likely help us in our feature engineering process.
To learn more about our machine learning project on Ames, Iowa Housing Prices, visit our Dash App in the link above to experience an interactive run-through of our research and findings.