NYC Data Science Academy| Blog
Bootcamps
Lifetime Job Support Available Financing Available
Bootcamps
Data Science with Machine Learning Flagship ๐Ÿ† Data Analytics Bootcamp Artificial Intelligence Bootcamp New Release ๐ŸŽ‰
Free Lesson
Intro to Data Science New Release ๐ŸŽ‰
Find Inspiration
Find Alumni with Similar Background
Job Outlook
Occupational Outlook Graduate Outcomes Must See ๐Ÿ”ฅ
Alumni
Success Stories Testimonials Alumni Directory Alumni Exclusive Study Program
Courses
View Bundled Courses
Financing Available
Bootcamp Prep Popular ๐Ÿ”ฅ Data Science Mastery Data Science Launchpad with Python View AI Courses Generative AI for Everyone New ๐ŸŽ‰ Generative AI for Finance New ๐ŸŽ‰ Generative AI for Marketing New ๐ŸŽ‰
Bundle Up
Learn More and Save More
Combination of data science courses.
View Data Science Courses
Beginner
Introductory Python
Intermediate
Data Science Python: Data Analysis and Visualization Popular ๐Ÿ”ฅ Data Science R: Data Analysis and Visualization
Advanced
Data Science Python: Machine Learning Popular ๐Ÿ”ฅ Data Science R: Machine Learning Designing and Implementing Production MLOps New ๐ŸŽ‰ Natural Language Processing for Production (NLP) New ๐ŸŽ‰
Find Inspiration
Get Course Recommendation Must Try ๐Ÿ’Ž An Ultimate Guide to Become a Data Scientist
For Companies
For Companies
Corporate Offerings Hiring Partners Candidate Portfolio Hire Our Graduates
Students Work
Students Work
All Posts Capstone Data Visualization Machine Learning Python Projects R Projects
Tutorials
About
About
About Us Accreditation Contact Us Join Us FAQ Webinars Subscription An Ultimate Guide to
Become a Data Scientist
    Login
NYC Data Science Acedemy
Bootcamps
Courses
Students Work
About
Bootcamps
Bootcamps
Data Science with Machine Learning Flagship
Data Analytics Bootcamp
Artificial Intelligence Bootcamp New Release ๐ŸŽ‰
Free Lessons
Intro to Data Science New Release ๐ŸŽ‰
Find Inspiration
Find Alumni with Similar Background
Job Outlook
Occupational Outlook
Graduate Outcomes Must See ๐Ÿ”ฅ
Alumni
Success Stories
Testimonials
Alumni Directory
Alumni Exclusive Study Program
Courses
Bundles
financing available
View All Bundles
Bootcamp Prep
Data Science Mastery
Data Science Launchpad with Python NEW!
View AI Courses
Generative AI for Everyone
Generative AI for Finance
Generative AI for Marketing
View Data Science Courses
View All Professional Development Courses
Beginner
Introductory Python
Intermediate
Python: Data Analysis and Visualization
R: Data Analysis and Visualization
Advanced
Python: Machine Learning
R: Machine Learning
Designing and Implementing Production MLOps
Natural Language Processing for Production (NLP)
For Companies
Corporate Offerings
Hiring Partners
Candidate Portfolio
Hire Our Graduates
Students Work
All Posts
Capstone
Data Visualization
Machine Learning
Python Projects
R Projects
About
Accreditation
About Us
Contact Us
Join Us
FAQ
Webinars
Subscription
An Ultimate Guide to Become a Data Scientist
Tutorials
Data Analytics
  • Learn Pandas
  • Learn NumPy
  • Learn SciPy
  • Learn Matplotlib
Machine Learning
  • Boosting
  • Random Forest
  • Linear Regression
  • Decision Tree
  • PCA
Interview by Companies
  • JPMC
  • Google
  • Facebook
Artificial Intelligence
  • Learn Generative AI
  • Learn ChatGPT-3.5
  • Learn ChatGPT-4
  • Learn Google Bard
Coding
  • Learn Python
  • Learn SQL
  • Learn MySQL
  • Learn NoSQL
  • Learn PySpark
  • Learn PyTorch
Interview Questions
  • Python Hard
  • R Easy
  • R Hard
  • SQL Easy
  • SQL Hard
  • Python Easy
Data Science Blog > Machine Learning > Data Studying to Predict Iowa Housing Prices

Data Studying to Predict Iowa Housing Prices

Tristan Dresbach
Posted on Jan 9, 2019
The skills the author demoed here can be learned through taking Data Science with Machine Learning bootcamp with NYC Data Science Academy.

Introduction

The goal of this project was to utilize supervised machine learning techniques to predict housing prices in Ames, Iowa. The data set was provided by Kaggle, an online community of data scientists and machine learners, owned by Google.

My steps towards creating a highly accurate model were as follows:

  1. Data exploration and cleaning
  2. Feature engineering
  3. Modeling
  4. Aggregating the models built for additional accuracy

I. Data Exploration and Cleaning

The data set was split into a training dataset containing 1,460 sales and a test dataset with 1,419 sales. There were 80 variables, including the sale price, with 20 continuous, 14 discrete, 23 nominal, and 23 ordinal variables.

As sale price is the value I was looking to predict, it was also the first variable I examined. The sale price exhibited a right skewed distribution which was corrected by taking the log. A Box-Cox transformation was also applied, but the improvement, compared to simply applying a log transformation, was not significant.

Data Studying to Predict Iowa Housing Prices

After the log transform:

Data Studying to Predict Iowa Housing Prices

The next thing I noticed was the large amount of missing values for 34 different features (Sale Price shows NAs as I combined the test and train data sets):

Feature

The majority of the missing data corresponded to the absence of a feature. For example the Basement features, mentioned in the above table, showed up as "NA" if the house did not have a basement. These were imputed as 0 or "None" depending on the feature type. The remaining missing values fell into two types:

1) Categorical variables:

these were imputed after careful analysis of the relationship with Sale Price. For example, Kitchen Quality was imputed based on the sale price with the labels being: excellent (Ex) good (Gd), average (TA), or fair (Fa).

2) Numerical variables:

these were imputed via mean or median, whichever seemed most appropriate. The only numerical feature not imputed was Garage Year Built as it had a correlation coefficient of 0.84 with the year the house was built.

The final step before undertaking the feature engineering was to check for outliers. To do so I analyzed the most important indicators for sale price: Ground Living Area and Overall Quality. This allowed me to identify two outliers which were then eliminated from the data set:

II. Feature Engineering

Before creating or editing features, I first wanted to better understand the correlation amongst the variables of the housing data set. The heatmap below illustrates this structure. In this chart, darker colors indicate a larger correlation between two variables while lighter colors show a smaller correlation. The bottom row indicates the correlation between sale price and the various features included in the dataset. The correlation structure confirms the presumption that variables such as overall quality, age, and size being highly correlated with price.

Data Studying to Predict Iowa Housing Prices

This matrix of coefficients validated my thinking that certain features could be combined, entirely eliminated or re-engineered to extract additional meaning from the data while limiting noise. Here are the main modifications that I proceeded to do:

  1. Total Bathrooms: Sum of Above Ground Full, Half Baths, Basement Full and Half Bath.
  2. House Age: The difference between Year Sold and Year Remodeled
  3. Remodeled: Binary value that takes 1 if the house has a remodeled year that is different from the year it was built in
  4. Is New: Binary value that takes 1 if Year Sold equals Year Built
  5. Neighborhood Wealth: A categorical value (1-4) of different groups of houses based on disparities in their neighborhoods median wealth.
  6. TotalSF, Total Porch SF, and BsmtBath: sum of the square footage of their sub-features
  7. Exterior & Condition: Exterior1/2 and Condition1/2 were respectively combined

All re-engineered features were then analyzed to make sure they derived additional value compared to their predecessors. Below is the TotalSF feature which was the best re-engineered predictor of Sale Price:

III. Modeling Data 

  1. Linear Models:

Considering the large amount of features in this dataset, I decided not to build a basic multiple linear regression model and opted instead to start off with penalized regression models. All three models (Ridge, Lasso and Elastic Net) were built using cross-validation with 4 train folds and 1 test fold with each fold containing 20% of the train data. As expected, Lasso had a lower amount of variables kept as coefficients that are all progressively pushed to 0 as lambda tends towards infinity, and the elastic net model performed the best. However, the Ridge model ended up having the highest Kaggle score as seen below:

Model Specification Variables Used CV R^2 CV RMSE Kaggle Score
Ridge CV Best Lambda: 0.035 All 0.9346 0.1238 0.1313
Lasso CV Best Lambda: 72 0.9331 0.1207 0.1439
Elastic Net CV Best Alpha: 0.08

Best Lambda: 0.0163

81 0.9415 0.1179 0.1490

Below are the top-20 variables from the Ridge CV model. One should note that in general, the size of the coefficients is not necessarily an indication of importance. However, I have scaled all the variables for this chart, so one can directly infer the importance of these coefficients.

2. Tree-based models:

1) Random Forest: The reason why I included the Random Forest model is because it tends not to over-fit the training set, since each decision tree is limited to a number of factors. Although each individual decision tree might over-fit the data, all of the trees can be assembled to make a stronger predictor. This can be done because all of the individual trees are uncorrelated. As long as we have enough trees in the Random Forest, the 'noise' of each tree will be averaged out and the trend from the strong predictors will stand out.

Another benefit from this model is that it does not assume a linear relationship between the response and explanatory variables. However, one large disadvantage of this model is that its accuracy can heavily suffer when it is used for predicting based on data it has not seen before.

2) XGBoost: XGBoost produces extremely accurate models but can be prone to over-fitting, which contrasts well with Random Forest. The general methodology of boosting is that it creates a decision tree, and for every subsequent decision tree, it utilizes the residuals of that previous tree to make its prediction. As the number of trees in the boosting model is increased, the results become closer to their true value. This can lead to very accurate results but can generate strong over-fitting as the model's trees are correlated with each other.

I will not enumerate the multiple hyper and base parameters used for both of these models, but I have listed both of their RMSE scores on Kaggle:

Random Forest: 0.1311

XGBoost: 0.1202

Below is a graph of the importance of the XGBoost features. This feature list is actually quite similar to that of the Ridge CV model and maintains a rationalizable order.

IV. Aggregating the Models Built for Additional Accuracy

Having created the 5 models I wanted, I proceeded to use two different techniques to aggregate said models for more accurate predictions.

  1. Averaged Model: I combined all 5 models by assigning a unique weight to each model. The ideal weights that minimized RMSE were calculated using scipy.optimize.minimize.
  2. Stacked Model: Stacking highlights each of the 5 base models where they perform best and discredits them where they perform poorly. For this reason, stacking is most effective when the base models vary, hence my having done two different categories of models. To execute the stacking, I used the StackingCVRegressor, which works as depicted below:

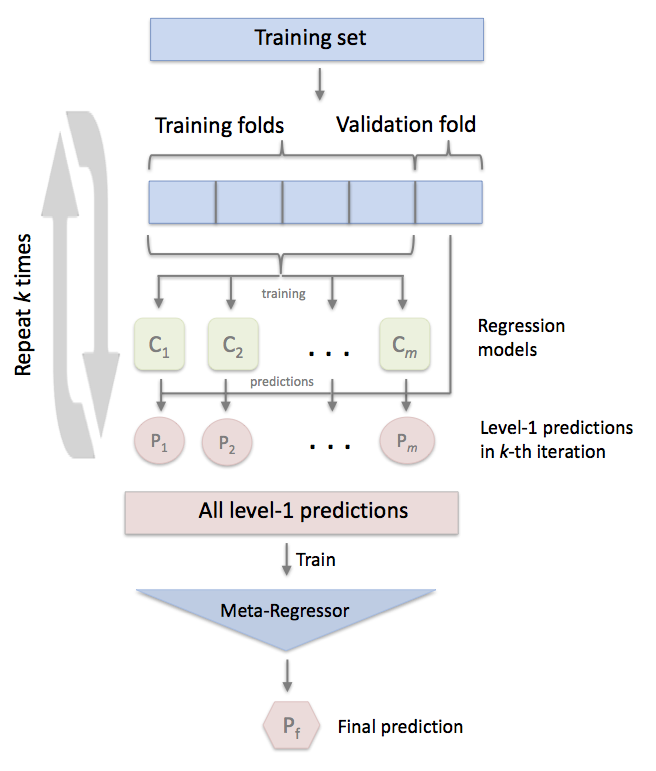
The user can choose which model is used as the "meta-regressor" for optimizing the stacked model. Of the 3 different models (SVM, Lasso and Random-Forest) I used for the meta regressor, Lasso performed the best, with a Kaggle score of 0.11544 which was my final submission!


Please feel free to reach out to me on LinkedIn if you have any questions or concerns, thanks!

About Author

Tristan Dresbach

Tristan is an aspiring data scientist with a track record of using data to drive significant and tangible business results in retail and financial services. He has hands on experience in R and Python in web-scraping, data visualization,...
View all posts by Tristan Dresbach >

Related Articles

Capstone
Catching Fraud in the Healthcare System
Capstone
The Convenience Factor: How Grocery Stores Impact Property Values
Capstone
Acquisition Due Dilligence Automation for Smaller Firms
Machine Learning
Pandemic Effects on the Ames Housing Market and Lifestyle
Machine Learning
The Ames Data Set: Sales Price Tackled With Diverse Models

Leave a Comment

Cancel reply

You must be logged in to post a comment.

Philippe Heitzmann September 22, 2020
Very informative post and impressive Kaggle results. Good stuff!

View Posts by Categories

All Posts 2399 posts
AI 7 posts
AI Agent 2 posts
AI-based hotel recommendation 1 posts
AIForGood 1 posts
Alumni 60 posts
Animated Maps 1 posts
APIs 41 posts
Artificial Intelligence 2 posts
AWS 13 posts
Banking 1 posts
Big Data 50 posts
Branch Analysis 1 posts
Capstone 206 posts
Career Education 7 posts
CLIP 1 posts
Community 72 posts
Congestion Zone 1 posts
Content Recommendation 1 posts
Cosine SImilarity 1 posts
Data Analysis 5 posts
Data Engineering 1 posts
Data Engineering 3 posts
Data Science 7 posts
Data Science News and Sharing 73 posts
Data Visualization 324 posts
Events 5 posts
Featured 37 posts
Function calling 1 posts
FutureTech 1 posts
Generative AI 5 posts
Hadoop 13 posts
Image Classification 1 posts
Innovation 2 posts
Kmeans Cluster 1 posts
LLM 6 posts
Machine Learning 364 posts
Marketing 1 posts
Meetup 144 posts
MLOPs 1 posts
Model Deployment 1 posts
Nagamas69 1 posts
NLP 1 posts
OpenAI 5 posts
OpenNYC Data 1 posts
pySpark 1 posts
Python 16 posts
Python 458 posts
Python data analysis 4 posts
Python Shiny 2 posts
R 404 posts
R Data Analysis 1 posts
R Shiny 560 posts
R Visualization 445 posts
RAG 1 posts
RoBERTa 1 posts
semantic rearch 2 posts
Spark 17 posts
SQL 1 posts
Streamlit 2 posts
Student Works 1687 posts
Tableau 12 posts
TensorFlow 3 posts
Traffic 1 posts
User Preference Modeling 1 posts
Vector database 2 posts
Web Scraping 483 posts
wukong138 1 posts

Our Recent Popular Posts

AI 4 AI: ChatGPT Unifies My Blog Posts
by Vinod Chugani
Dec 18, 2022
Meet Your Machine Learning Mentors: Kyle Gallatin
by Vivian Zhang
Nov 4, 2020
NICU Admissions and CCHD: Predicting Based on Data Analysis
by Paul Lee, Aron Berke, Bee Kim, Bettina Meier and Ira Villar
Jan 7, 2020

View Posts by Tags

#python #trainwithnycdsa 2019 2020 Revenue 3-points agriculture air quality airbnb airline alcohol Alex Baransky algorithm alumni Alumni Interview Alumni Reviews Alumni Spotlight alumni story Alumnus ames dataset ames housing dataset apartment rent API Application artist aws bank loans beautiful soup Best Bootcamp Best Data Science 2019 Best Data Science Bootcamp Best Data Science Bootcamp 2020 Best Ranked Big Data Book Launch Book-Signing bootcamp Bootcamp Alumni Bootcamp Prep boston safety Bundles cake recipe California Cancer Research capstone car price Career Career Day ChatGPT citibike classic cars classpass clustering Coding Course Demo Course Report covid 19 credit credit card crime frequency crops D3.js data data analysis Data Analyst data analytics data for tripadvisor reviews data science Data Science Academy Data Science Bootcamp Data science jobs Data Science Reviews Data Scientist Data Scientist Jobs data visualization database Deep Learning Demo Day Discount disney dplyr drug data e-commerce economy employee employee burnout employer networking environment feature engineering Finance Financial Data Science fitness studio Flask flight delay football gbm Get Hired ggplot2 googleVis H20 Hadoop hallmark holiday movie happiness healthcare frauds higgs boson Hiring hiring partner events Hiring Partners hotels housing housing data housing predictions housing price hy-vee Income industry Industry Experts Injuries Instructor Blog Instructor Interview insurance italki Job Job Placement Jobs Jon Krohn JP Morgan Chase Kaggle Kickstarter las vegas airport lasso regression Lead Data Scienctist Lead Data Scientist leaflet league linear regression Logistic Regression machine learning Maps market matplotlib Medical Research Meet the team meetup methal health miami beach movie music Napoli NBA netflix Networking neural network Neural networks New Courses NHL nlp NYC NYC Data Science nyc data science academy NYC Open Data nyc property NYCDSA NYCDSA Alumni Online Online Bootcamp Online Training Open Data painter pandas Part-time performance phoenix pollutants Portfolio Development precision measurement prediction Prework Programming public safety PwC python Python Data Analysis python machine learning python scrapy python web scraping python webscraping Python Workshop R R Data Analysis R language R Programming R Shiny r studio R Visualization R Workshop R-bloggers random forest Ranking recommendation recommendation system regression Remote remote data science bootcamp Scrapy scrapy visualization seaborn seafood type Selenium sentiment analysis sentiment classification Shiny Shiny Dashboard Spark Special Special Summer Sports statistics streaming Student Interview Student Showcase SVM Switchup Tableau teachers team team performance TensorFlow Testimonial tf-idf Top Data Science Bootcamp Top manufacturing companies Transfers tweets twitter videos visualization wallstreet wallstreetbets web scraping Weekend Course What to expect whiskey whiskeyadvocate wildfire word cloud word2vec XGBoost yelp youtube trending ZORI

NYC Data Science Academy

NYC Data Science Academy teaches data science, trains companies and their employees to better profit from data, excels at big data project consulting, and connects trained Data Scientists to our industry.

NYC Data Science Academy is licensed by New York State Education Department.

Get detailed curriculum information about our
amazing bootcamp!

Please enter a valid email address
Sign up completed. Thank you!

Offerings

  • HOME
  • DATA SCIENCE BOOTCAMP
  • ONLINE DATA SCIENCE BOOTCAMP
  • Professional Development Courses
  • CORPORATE OFFERINGS
  • HIRING PARTNERS
  • About

  • About Us
  • Alumni
  • Blog
  • FAQ
  • Contact Us
  • Refund Policy
  • Join Us
  • SOCIAL MEDIA

    ยฉ 2025 NYC Data Science Academy
    All rights reserved. | Site Map
    Privacy Policy | Terms of Service
    Bootcamp Application