Machine Learning for Home Improvement: Predicting House Price After Renovation
Extracting new value from the old Ames housing dataset
Motivation
Data Science in the Real Estate sector has matured to a point of saturation as most real estate companies utilize a data-driven approach to pricing and investment decision-making. Recently, Zillow has even decided to decrease dependence on data science and discontinued their machine-learning assisted business model. Our challenge was to look at the classic Ames Iowa dataset from a new angle and come up with a value proposition beyond just predicting the price of a house.
We decided to focus on real-world home improvement & renovations. Our final deliverable offers much more than an estimated price for a house or an app with a square-footage slider showing price change per additional square foot (sf). In practice, homeowners won’t expand their house by a few sf to get a higher valuation. Instead, they would remodel the kitchen or garage or maybe finish the basement into livable space. Our final product is an online tool that allows the user to select a house in Ames and see the effect of specific home improvement projects on house price.
With this tool, real estate companies can offer additional pricing information for clients looking to sell, and make suggestions to remodel parts of the house in order to increase listing price. Remodeling contractors or even home-supply retailers can utilize the tool for marketing purposes, by showing customers the increased house value in relation to how much is charged for the renovation.
Exploring Ames Iowa Houses Data
Ames is a small city in Iowa with a population of about 65,000 and is the college town of Iowa State University. The Ames housing dataset consists of 2578 house records and includes sale price and individual house attributes. The image below maps the houses from the dataset (an interactive map can be found on the app).
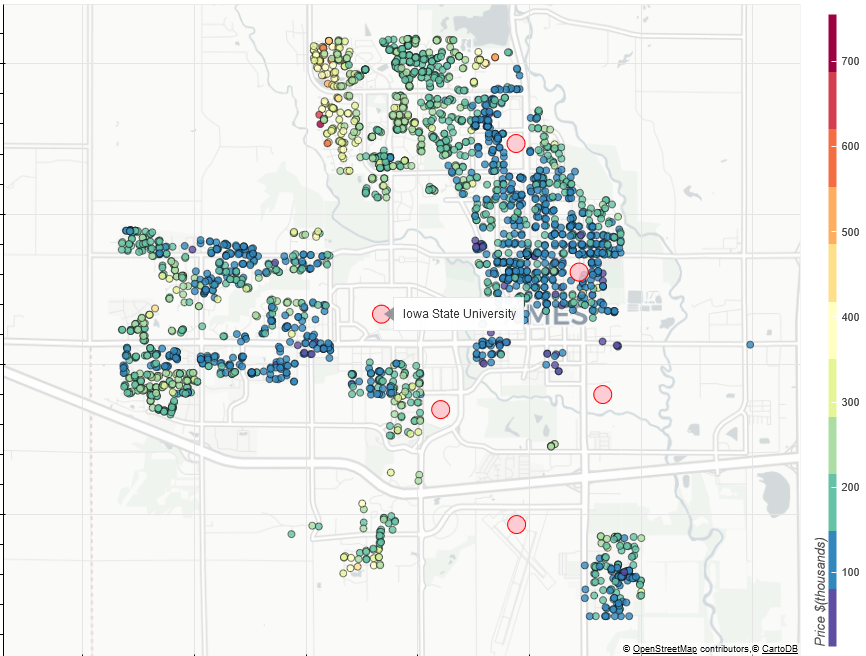
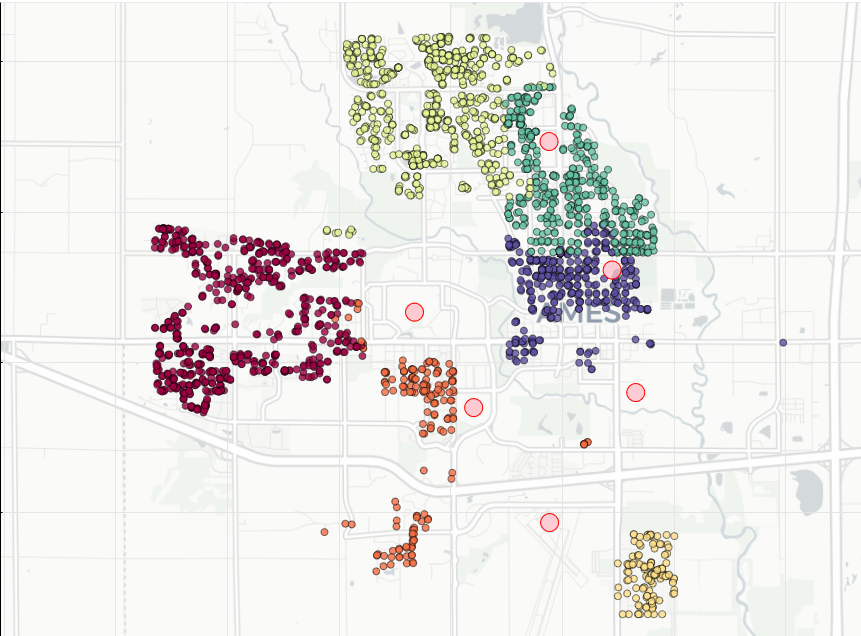
From figure 1 we can see that houses near the center of town are priced lower than areas in the far northwest, west, and just south of Iowa State University. Instead of using the 27 individual neighborhoods to explore the data, we decided to separate the city as per sectors defined by the city’s tourism bureau (figure 2 below).
With the city separated into the 6 sectors, we observe marked differences in the house prices in each sector. The northwest is the most expensive, and southeast, north, and downtown areas are the cheapest (figure 3).
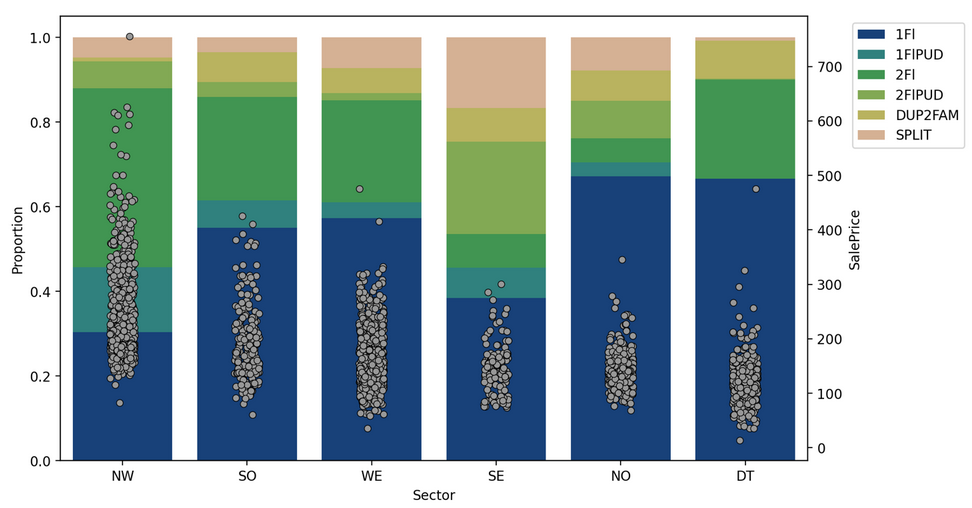
Figure 3: Stacked bar charts of the type of house for each sector, with house prices overlaid
FIgure 4 below is a scatter plot of the years each house was built. Lower prices in the north and downtown areas are due to the age of the house. In the north and downtown areas there are very few houses built after 1980 and 1960, respectively.
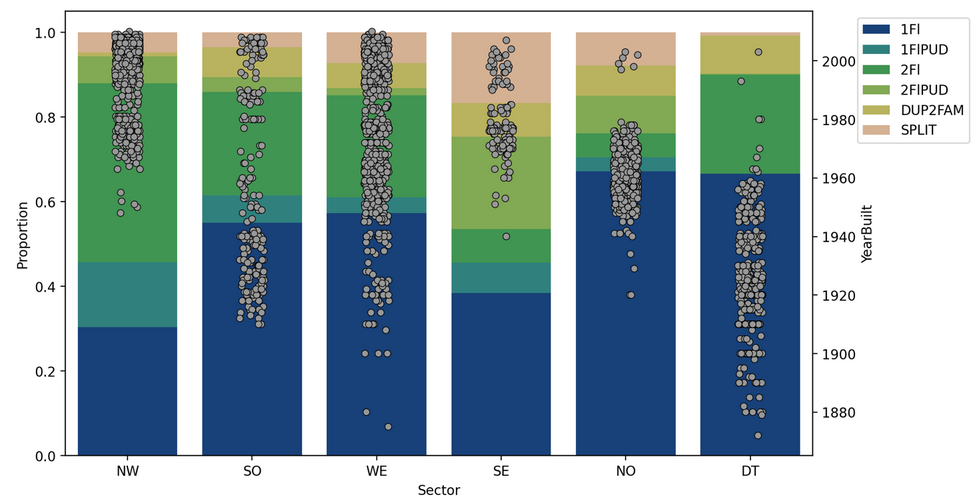
Figure 4: Stacked bar charts of the type of house for each sector, with house "year built" overlaid
The lower prices in the southeast (SE) sector of Ames is not due to house age but to the type of houses in the area. We see that SE has a larger proportion of houses that are of Split Foyer and Duplex. These houses are shown to have lower price per sf than other house types, especially as the total sf increases (figure 5, right)
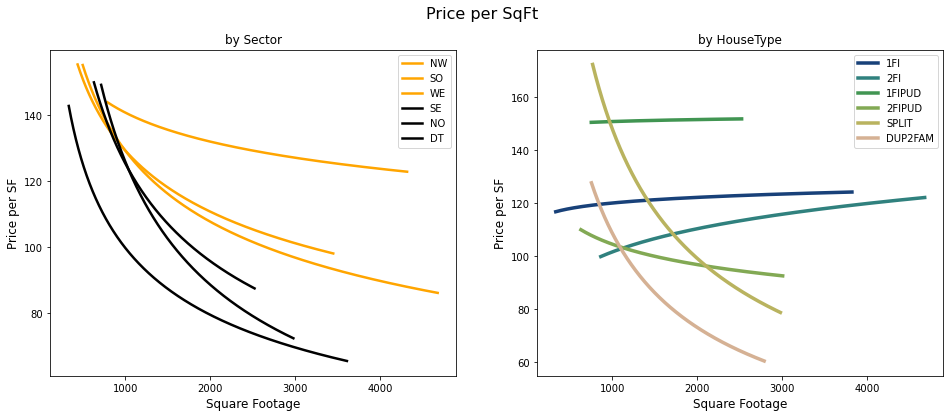
Figure 5: Price per SF versus house size for each sector (left) and for type of house (right)
Equipped with an idea of the general market, including geographical and housing type price trends, in the next section we explore individual house attributes and conduct feature engineering.
Feature Selection & Engineering Data
With over 81 features, the Ames Iowa dataset has a lot of information on house features, what condition those features are in, and how big parts of the house are. Finding our final features took a lot of trial and error to see what worked and some caution to avoid multicollinearity. Our starting point was discussing which features were important but also realistic in a home renovation model. Our final list of features were being used in two ways: one, for creating machine learning models that predict how much value a renovation will add, and two, as interactive features on our app interface.
Feature Manipulation
Some features like basement condition, garage quality, and fireplaces were lacking observations in their categories. In order to keep our predictions accurate, we simplified categories that didn’t have enough information. Below you can see that for basement conditions, we moved the “Poor” and “Excellent” categories into the “Fair” and “Good” categories, respectively. We repeated this process for several other features.
Feature Engineering
From our initial saturated model we found a high variance inflation factor among many features. This led us to combine key features that had a large effect on predicting house price. Below is a list of the features we created:
Total Square Footage = sum of first floor + second floor + finished basement square feet
Total Porch Area = sum of all porch & deck square feet
Total Basement Bathrooms = sum of half & full bathrooms in basement
Total Above Ground Bathrooms = sum of half & full bathrooms above ground
Feature Selection
To begin sifting through our choices, we outputted a feature importance graph from a gradient boost model.
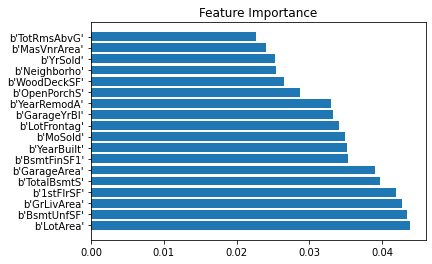
Figure 6: Feature Importances from the Gradient Boost model
This gave us a solid starting point to pick our final features. After frequent A/B model testing with different features included, we settled on 16 features to use in our ML model. The next section goes into more depth on what kinds of machine learning methods we used and why.
Hyperparameter Tuning & Data Model Selection
After finalizing the feature selection we needed to choose a model. The types of models we discussed in the bootcamp that could be applied to this sort of problem are linear regression models, tree-based models like random forest and gradient boosting, and, finally, support vector machines.
With the final dataset we tuned and explored the performance of each of these models. We started with linear regression, and for this, we performed one hot encoding for all the categorical variables. In addition, we trained the model on the log of the sale price to remove the right skew and limit the fanning of the continuous independent variables with respect to the dependent variable. As an example, the elimination of this fanning can be seen with respect to gross living area (Figure 7, bottom right).
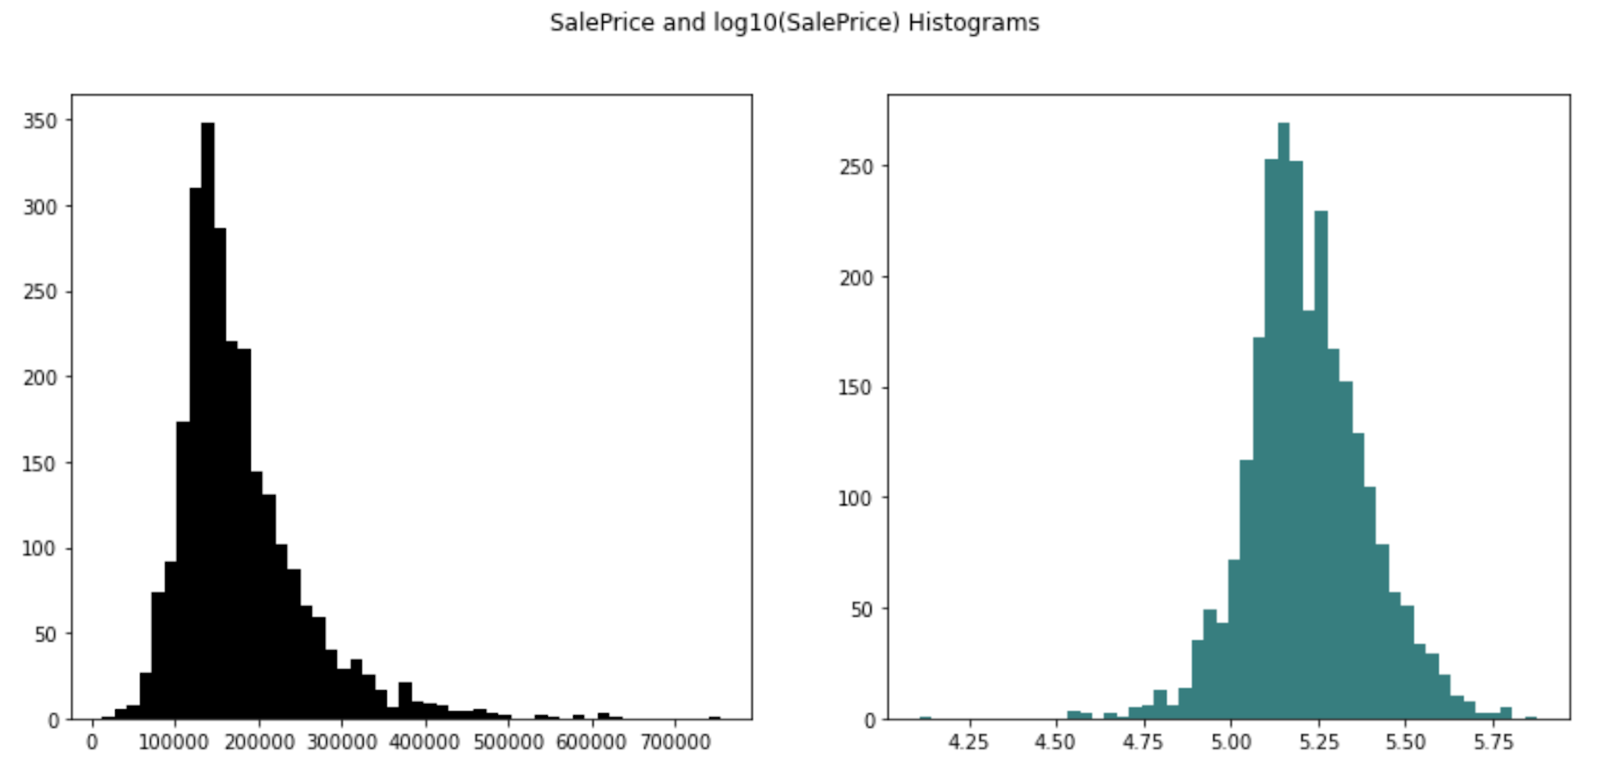
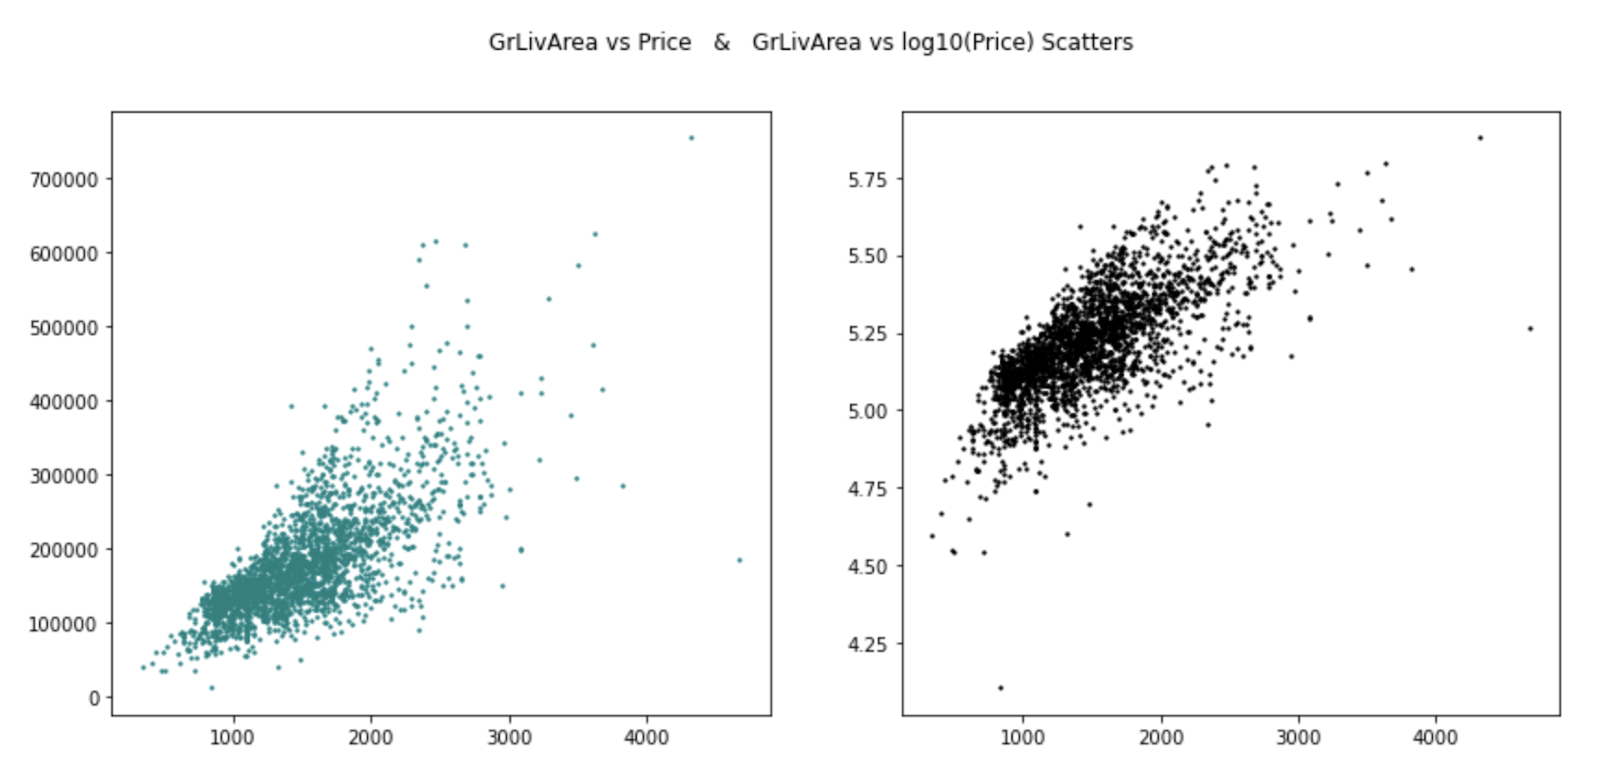
Figure 7. Effect of transforming the sale price to remove right skew (left) and eliminate fanning (right).
Once we had a linear model, we also explored the effect of penalization. For some data sets, standard linear models can overfit the dataset and actually result in a significantly lower R2 value for the test dataset. However, in our hands we saw that depending on exactly how the data was split, the test and train performance vs. lambda varied drastically.
For certain splits, we observed a maximum in the test dataset, and in others we observed that the test dataset performed better than the train (Fig. 9, top left). In order to get around this drastic variability issue, we performed 100 random splits and iterated over the lambda values for each. Then we averaged the scores for each lambda value of all 100 splits. However, even with this process, we didn’t observe any beneficial value of penalization for either Lasso or Ridge regression in that there was no increase in test R2 for any non-zero value of lambda (Fig. 9, right).
This led us to the conclusion that a standard unpenalized linear model would be our best choice for the linear model category. To evaluate the performance of the unpenalized linear model, we performed 100 random splits and plotted the distribution of test scores (Figure 8, bottom left).
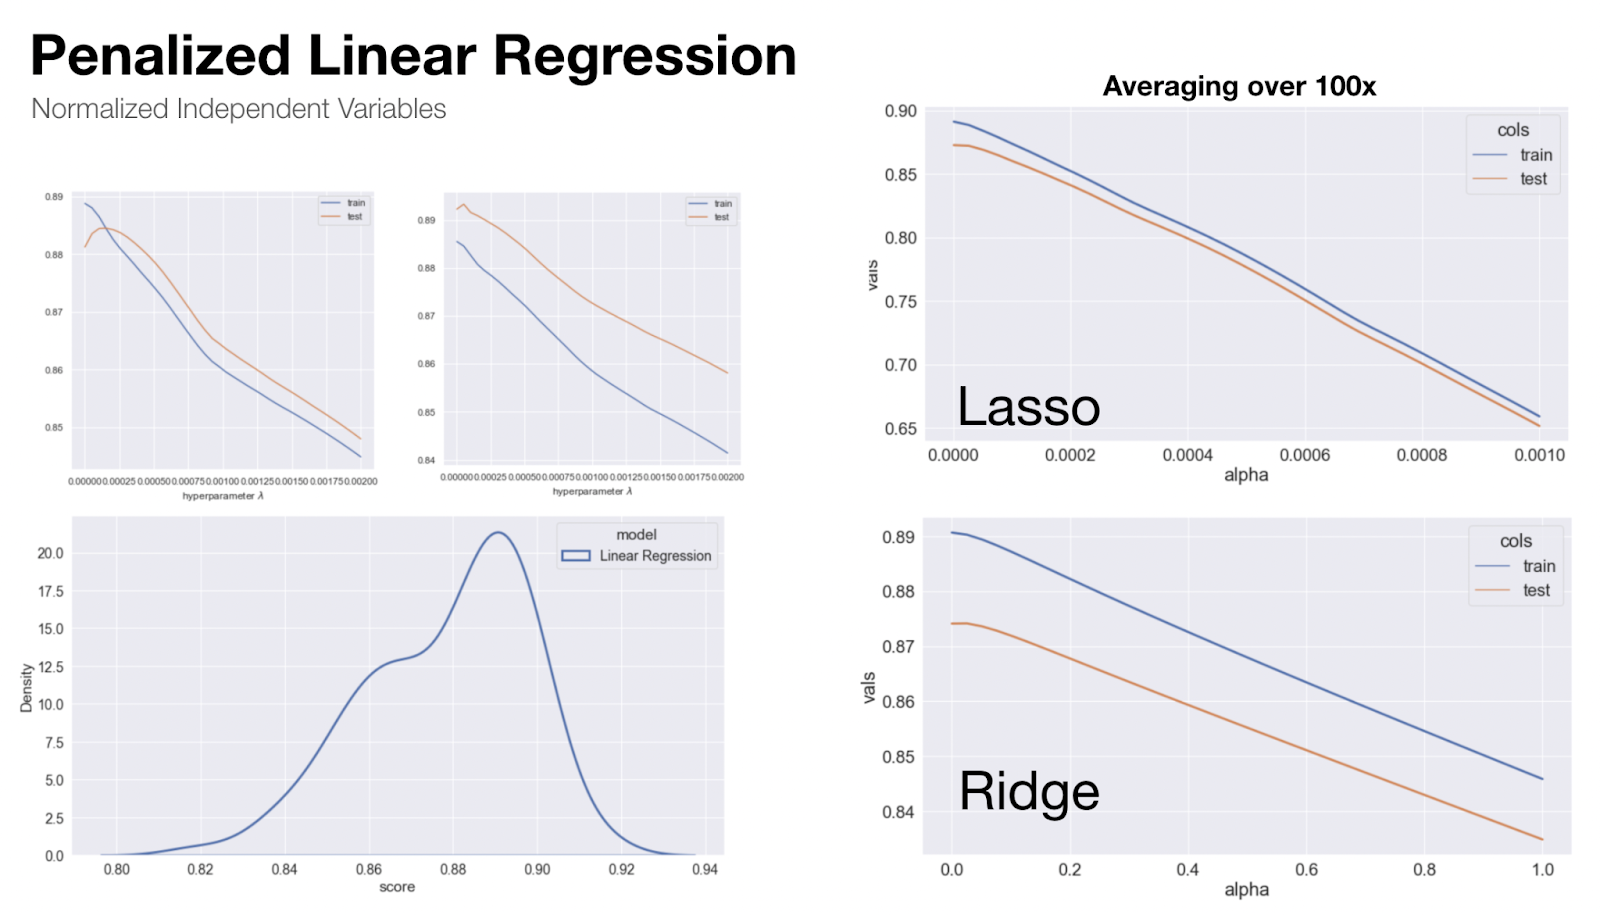
Figure 8: Evaluating penalized linear models to prevent over-fitting.
The next model we looked at was random forest regression. For random forest and all the other tree-based models we label encoded our categorical variables. We performed a thorough grid search with four-fold cross validation, and we identified the best parameters to be max_depth 15, min_samples_leaf 2, min_samples_split 3, and n_estimators 80. However, if we carry out the procedure described above, splitting the data and scoring 100 times, we observe that the distributions generated for tuned and default parameters are not significantly different.
To conclude this, we calculate the p-value using the two-sample t-test between these two distributions. By Occam's razor we chose to use the simplest of these two models, which is the default parameters for random forest.
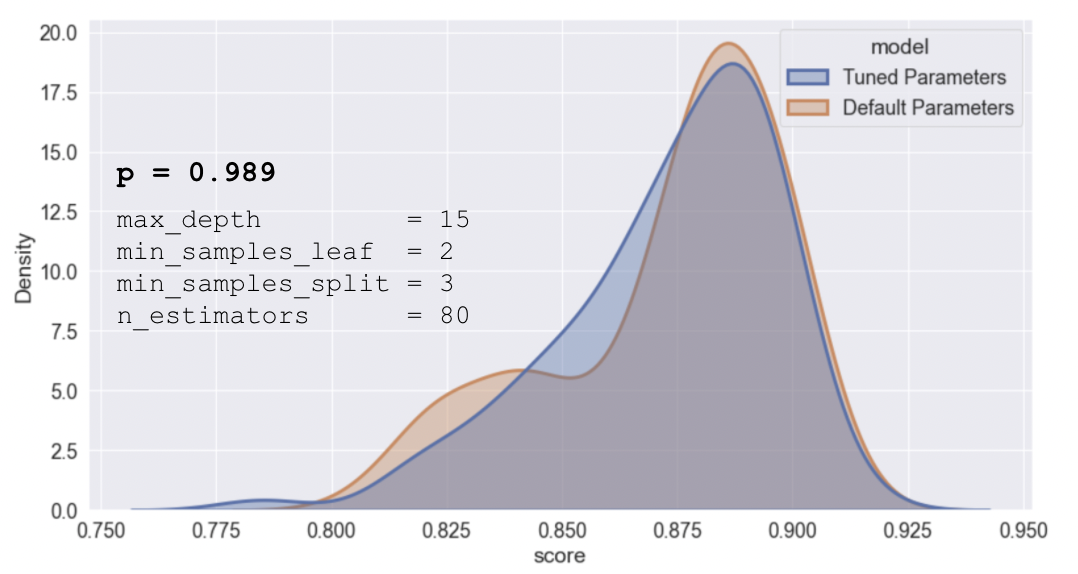
Figure 9: Evaluation of random forest regression with tuned hyperparameters and default parameters. No significant difference was detected for the tuned model.
We then performed a similar procedure on several different gradient boosting algorithms. The algorithms we tested included the base gradient boosting regressor in scikit-learn, XGBoost, CatBoost, and LightGBM. We again performed four-fold cross validation with grid search, and we tuned for learning_rate, max_step, subsample, and n_estimators. For scikit-learn and XGBoost we saw significant differences between our tuned parameters and the default parameters.
So our final models for these packages used the tuned parameters. For CatBoost and LightGBM there was no significant difference, so the default parameters for these packages were used. Aside: The Catboost website boasts that you get great performance without tuning your parameters, and indeed we actually did see that we didn’t need to tune this model in order to get great performance.
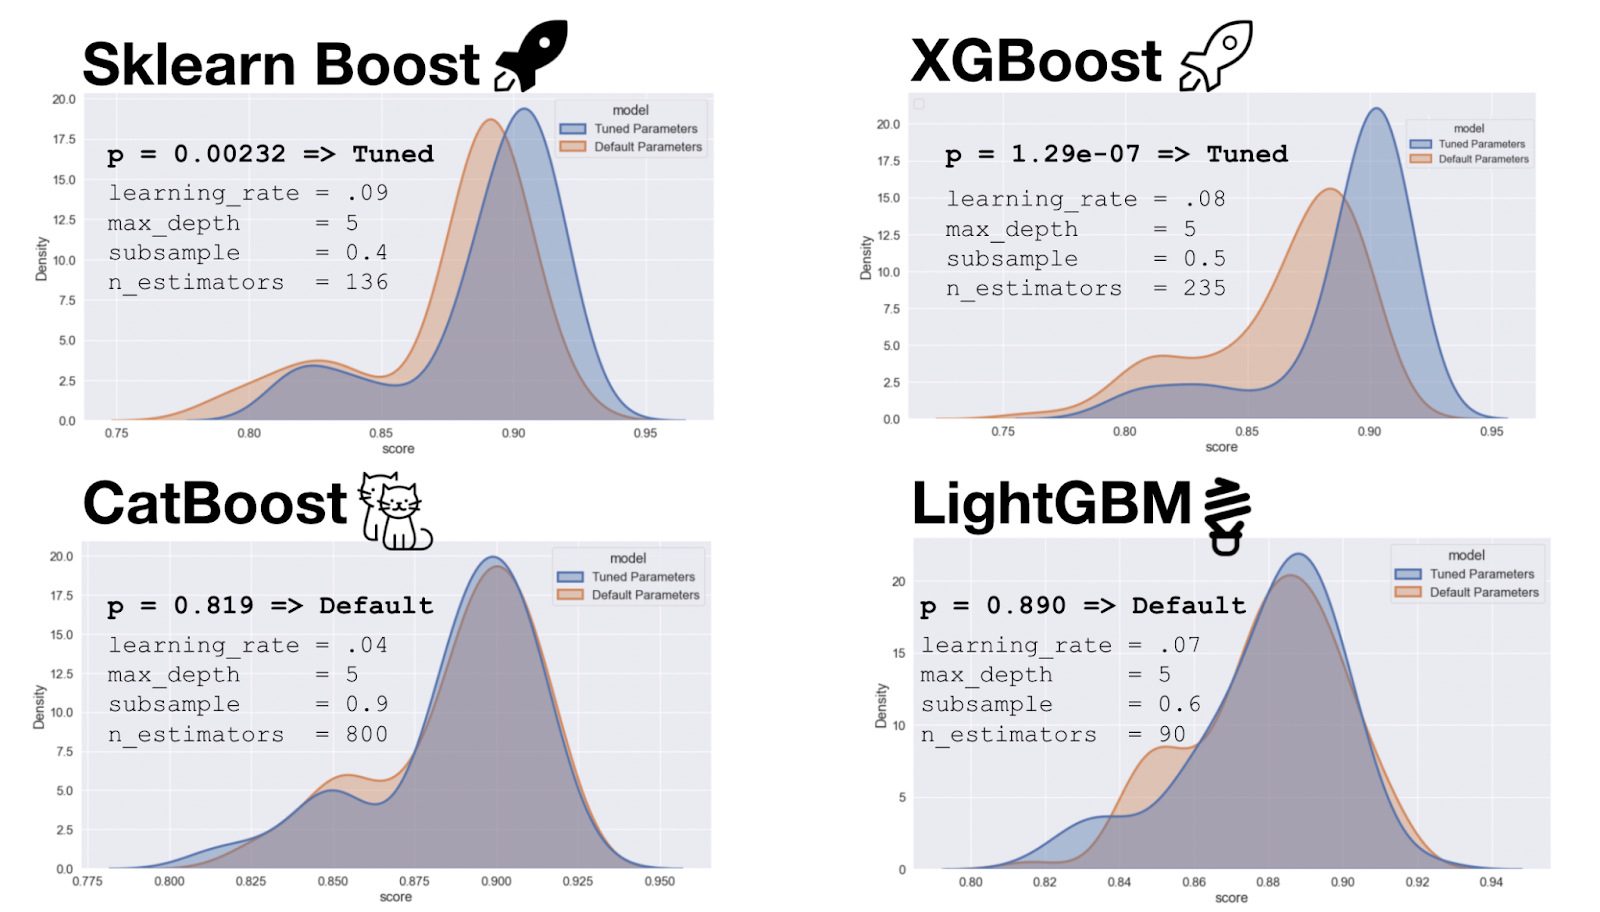
Figure 10: Evaluation of four gradient boosting models.
We also tuned a support vector machine model using the scikit-learn support vector regressor with a RBF (radial basis function) kernel. We were able to obtain a significant increase in performance with our tuned parameters over the defaults. However, despite our efforts, in the end SVM was still our worst performing model.
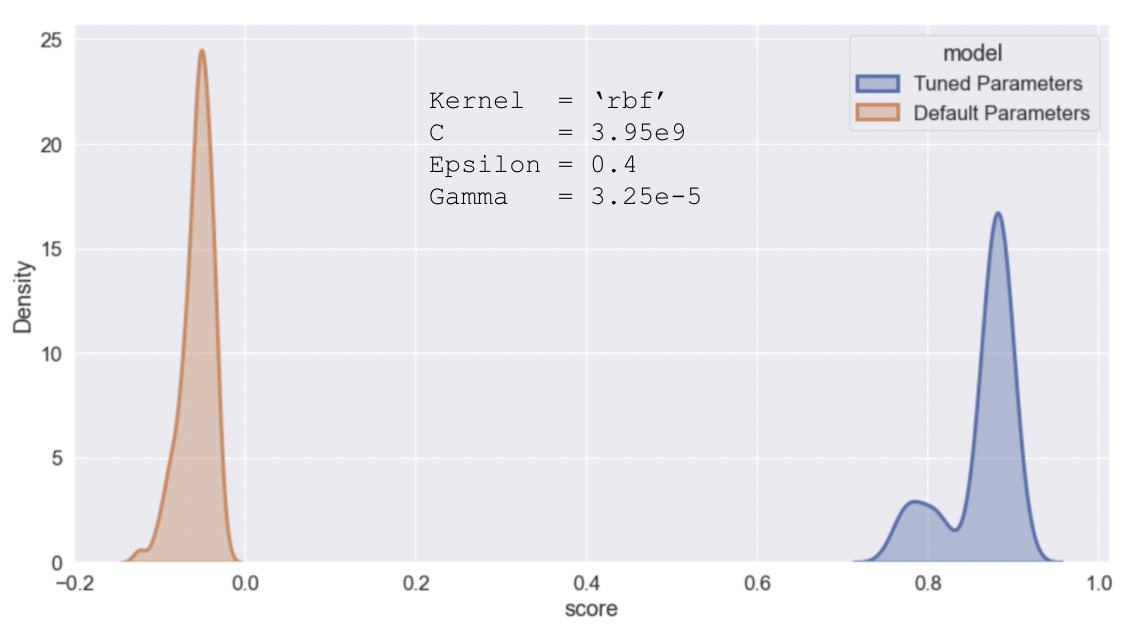
Figure 11: Evaluation of support vector regressor model with and without tuned parameters.
When we compare all of these models, we see that there is a significant overlap in the performance of these top three models (Figure 12, left), and a comparison of the pairwise p-values between these distributions indicate no significant difference between them (Figure 12, bottom left). Among these, scikit-learn and XGBoost both required parameter tuning, whereas CatBoost did not. Therefore, in the interest of using the simplest model, we chose to use CatBoost as our final model.
To verify that CatBoost is indeed significantly better than the four worst models, we also calculated the p-values between Catboost and those models (Figure 12, bottom right). Since each of these p-values were significant, CatBoost was used for all modeling going forward.
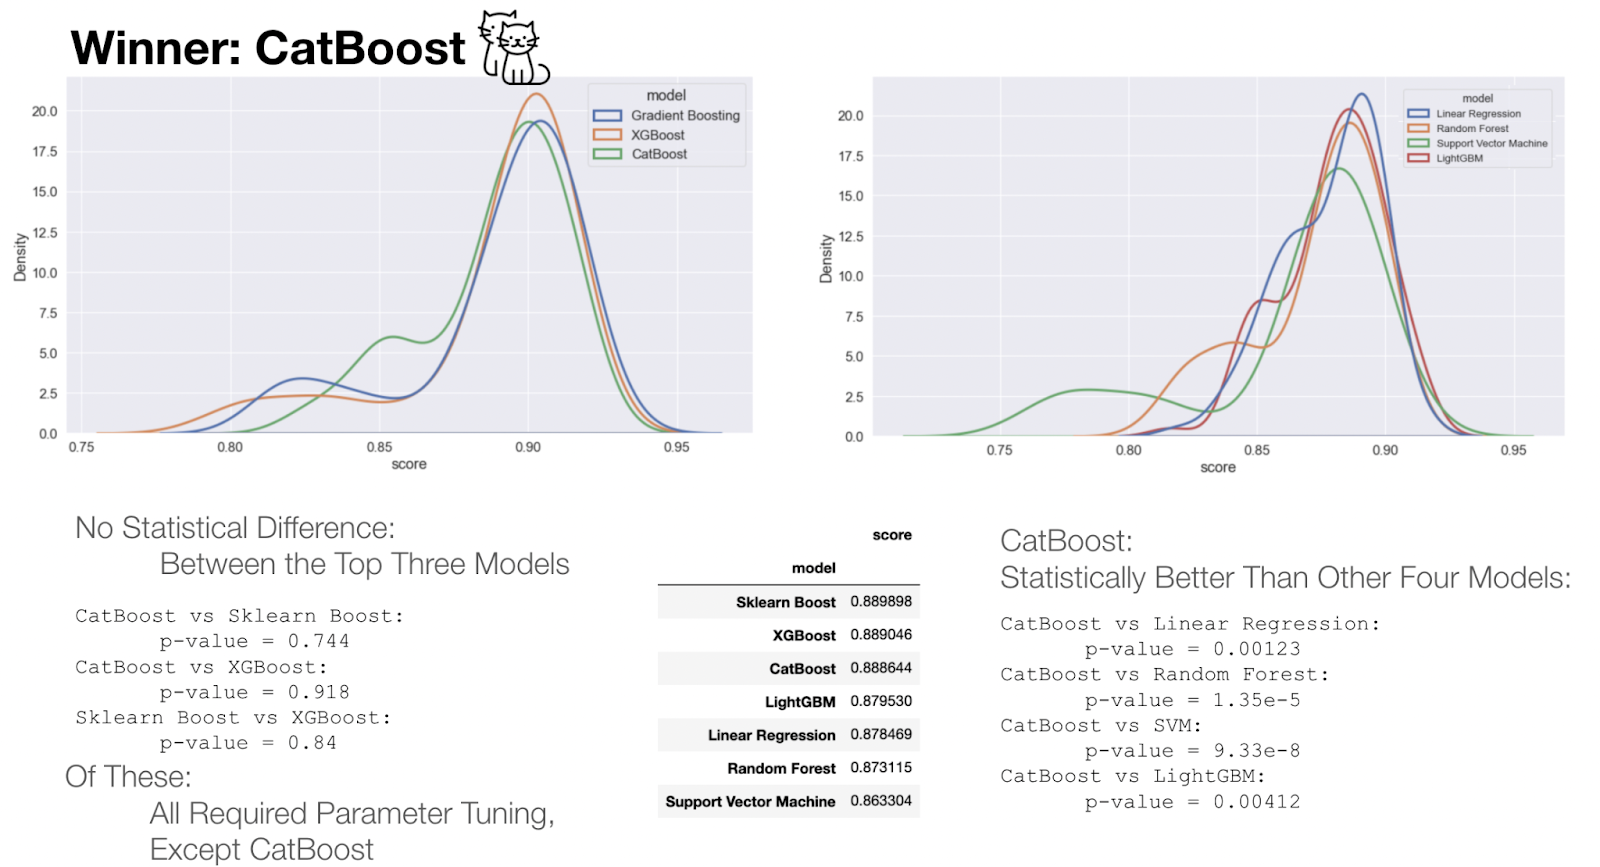
Figure 12: Comparison of the best models from each category.
Home-improvement in Ames: Using the App
The tool seeks to provide accurate estimates on home renovations. The main areas that brought the highest returns were finishing unfinished square footage, kitchen renovations and bathroom additions. The return seen is dependent upon the style, condition and location of the home. Inside the app, once an address is selected all relevant house details are updated and renovation options are based on the characteristics of the home. Seeing the return one would make, or lack thereof, would help to inform one in better decision making. Restrictions were put in place to account for the availability of changes that could be made.
As we continue to expand on this project, changes will be implemented to adjust for the limitations of the data.

Conclusions, Limitations & Next steps
Everyday we are faced with making practical decisions unequipped with the necessary foresight to ensure optimal outcomes. What machine learning offers to us is the ability to make better decisions, ones that are proactive rather than reactive. Contractors, real estate agents, and homeowners all share a common interest, seeing a return on their investments.
The data was restricted to Iowa; adding additional cities could help to explore patterns that are shared across them as well as within them. As we discovered, older, less desirable homes existed near the city center, while newer, more favorable houses existed further out in the surrounding area. Location as well as style of home greatly affected the change in returns seen on a given home. More observations would need to be taken into account to expand the application’s current offering.
The skills I demoed here can be learned through taking Data Science with Machine Learning bootcamp with NYC Data Science Academy.