Race and Gender Wage Gaps in the 1990's
Contributed by Kyle Szela. He is currently in the NYC Data Science Academy 12 week full time Data Science Bootcamp program taking place between April 11th to July 1st, 2016. This post is based on his first class project - R visualization (due on the 2nd week of the program).
Dataset:
The dataset I chose to work with was acquired from the UCI Machine Learning Repository. The data contains information retrieved from the 1994 and 1995 Current Population Surveys![]() , which were implemented by the U.S. Census Bureau. This dataset consists of roughly three hundred thousand different combinations of 40 variables. Each combination of variables is given a weight to indicate the number of persons in the U.S. with those attributes. So, multiplying a given observation's variables by it's weight will return the number of persons in the data set with those characteristics. The pertinent variables that I used for analysis were the class, age, education, race, sex, full-time indicator, and the indicator for an income of greater than or less than $50,000 for each observation row. The data itself was contained no missing values, and minimal cleaning was necessary.
, which were implemented by the U.S. Census Bureau. This dataset consists of roughly three hundred thousand different combinations of 40 variables. Each combination of variables is given a weight to indicate the number of persons in the U.S. with those attributes. So, multiplying a given observation's variables by it's weight will return the number of persons in the data set with those characteristics. The pertinent variables that I used for analysis were the class, age, education, race, sex, full-time indicator, and the indicator for an income of greater than or less than $50,000 for each observation row. The data itself was contained no missing values, and minimal cleaning was necessary.
After a preliminary review of the dataset, I had a few questions. I wanted to know if there was a difference in the percentage of people with an income of greater than $50,000 across race and gender, and, additionally, I wanted to know if any discrepancy could be attributed to other factors available in the dataset. There is an ongoing debate regarding wage gap in the U.S., and I and hoped to be able to clarify some aspects of where and what could be contributing factors.
I primarily focused on the differences between gender because different racial populations have higher densities in different areas of the U.S. For example, the Asian population density is higher across the western coast of the U.S., where the cost of living is inflated. If the cost of living is inflated, then the income of those persons may also be inflated relative to the rest of the U.S. I did not have geographical or cost of living data to accompany this dataset, and therefore could not normalize based on location. Gender, on the other hand, should be homogenous across the U.S. and should not be affected as much by cost of living by location.
Exploratory Data Analysis:
Initially, I graphed the differences between males and females across all available races using the following code:
This produced the graph shown below:
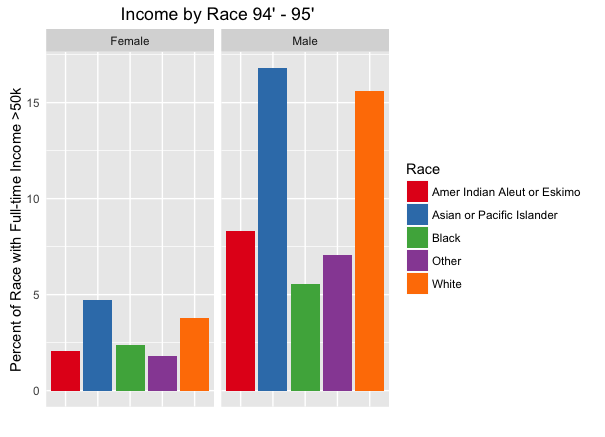

As you can see, the differences between race are pronounced, although more so between sex. Additionally, the proportions between genders are similar, with small differences between Black and Other. After observing this graph, I thought to additionally limit the information to only those with a full-time income. I wanted to avoid any gender bias resulting from the inclusion of individuals like stay-at-home parents, which may be skewed towards women, producing a smaller percentage of women making greater than $50,000 across all races. The results are shown below:

The results are interesting. By removing all those without full-time jobs, we see a large change in the male American Indian, Aleut, or Eskimo population. Additionally, we see that the changes across race in female are quite small in comparison to the changes across race in males.
Income by Sector:
After seeing that the proportions across race between males and females were similar, I wanted to investigate if this could have been due to differences in the different sectors where these individuals work. I used the below code to produce two graphs, one that shows the percentage of males or females in each sector, and the other that displays the percentage of males or females with an income greater than $50,000 in each sector.
The graphs for each are presented side-by-side, below:


The vast majority of both males and females seems to be employed in the private sector (73.61% and 73.64%, respectively), where we see a 12.34% difference in those with the selected income. The greatest difference between males and females appears in the Self-employed-incorporated sector, with a percentage difference in those with income greater than $50,000 of 29.41%, although the percentage of males and females in this sector is relatively small (2.08% and 4.72%, respectively).
The main takeaway from these graphs are that the second smallest wage gap difference is in the sector with the largest population of both males and females (with local government having a 12.05% difference between males and females with the selected income). The rest of the data indicates that the sectors other than private (save Local Government) are skewing the results towards males having a greater likelihood of having an income greater than $50,000, although not by much (the total difference between males and female with the selected income over all sectors is 13.73%).
Income by Age:
After reviewing these graphs, I also wanted to observe if there were any differences that arose due to the age of the individual. The results seem to be more staggering than any of the graphs presented above. The following code was used to produce a graph depicting percentage of individuals at a particular age making greater than $50,000:
And the graph produced:

This plot also provides some interesting information. Only those greater than 18 and less than 70 were included because as is evident near age 70 in the graph above, the data appears to be binned into a single age as it increases. Meaning, if the weight for a given combination of the 40 variables was low enough for, say, 71 and 72, it would have been binned as a single age, 71. This produces some erratic behavior and I didn't have the data to be able to separate between the ages, so those with age greater than 70 have been excluded.
Several trends are observable. As age increases to 25 years old, we see that the percentage of those making greater than $50,000 for both males and females is nearly equal. After this age, separation between the genders begins, and by 30 years old, the difference is 5.04%. There is a stark difference between the rate of increase in percentage of those in the selected income bracket between males and females as age climbs to about 50 years old, with the rate of increase for males as +1.18% per year and the rate of increase for females at +0.25% per year. Additionally, as was pointed out by Yannick Kimmel, a likely cause for the steady decline in percentage after age 50 is retirement. Those with a large income are able to retire earlier possibly producing the observed trend.
Income by Education:
Lastly, I wanted to see the effects of maximum education on the income difference across gender. For these plots, it was required to refactor the levels in the census data to improve readability with the following code:
After the refactoring was completed, I used the following code to produce the graphs for percentage of population with a certain education and percentage of those with a certain education with income greater than $50,000:
The associated grid:

Appearing above is quite a bit of information. Lets start with analyzing the education by population portion. As we can see, the majority of the population of both genders have a maximum education of acquiring a high-school diploma. Next in line are those who have some college, but no degree, and then those who have an undergraduate degree. The difference in percentage of each gender with a high-school diploma is very small. However, there appear to be fractionally more of the population of females with some college, but no degree than males. Additionally, there appears to be a slightly greater percentage of males who completed their undergraduate degree than females.
What's most impressive is the differences by education and gender of income. Males with a professional school degree are 24.96% more likely to have an income of greater than $50,000. The total percentage difference decreases as the level of education decreases, but in many cases, like those with an undergraduate degree, males are 3 times as likely as females to have the specified income bracket (12.18% and 36.13%, respectively).
Conclusions:
Across this entire dataset, one piece of information is overwhelmingly clear: males are much more likely to have an income greater than $50,000 in 1994-1995. Unfortunately, though, these results are correlational. One cannot make a causal conclusion. We saw that males have a higher rate of increase in income than females with respect to age, but it may be that males are much more likely to take jobs or positions with the salary ceiling is higher relative to females. Additionally, without more data to determine where each person is working and what each of their job titles are, I was not able to totally understand all the different relationships present. If I was able to get the data with regards to individual degrees, I would've been able to illustrate the differences or similarities between those with say, a degree in computer science, and we may find different results there. It also would be helpful to have the exact income that each person has. Along with data for degrees and job positions/titles, exact income data would allow the illustration of average pay for a gender or race. Lastly, for future research, it would be beneficial to have cost of living by geography as well as geographical data for individuals. With this, there is the opportunity to normalize the associated incomes and possibly draw more informative conclusions.