Mentor Matching using Machine Learning
I. Introduction
For our group's capstone project, we consulted with #BuiltByGirls, a non-profit organization that connects young students to professionals in the tech industry. The organization's goal is to increase the tech industry participation of individuals from an underrepresented group in society. Mentees (students) are paired with mentors (professionals) who meet with the student to introduce him/her to the industry. After every meeting, both mentors and mentees rate the session they had from 1 to 5, with 1 being the lowest and 5 being the highest.
The organization measures success through the ratings provided by students, that is why they wanted to know which features or variables increase the rating. Once this was accomplished, we created an algorithm that pairs students with professionals and a Flask dashboard to allow them to implement the algorithm in a user-friendly interface.
The team set out to finish the deliverables by using Python and going through all the steps needed for the algorithm to work off the dashboard. First, we cleaned and structured the corpus. After that, we did a logistic regression to help us identify the important features. Then we built a match scoring and allocation algorithm. Finally, we wrapped things up by putting our work in a Flask dashboard.
II. Data Cleaning
The dataset was composed of 80+ features, but we were able to reduce this and selected the 25 most important features. While the numeric data given to us was relatively clean, the string data was dirty and needed to be standardized.
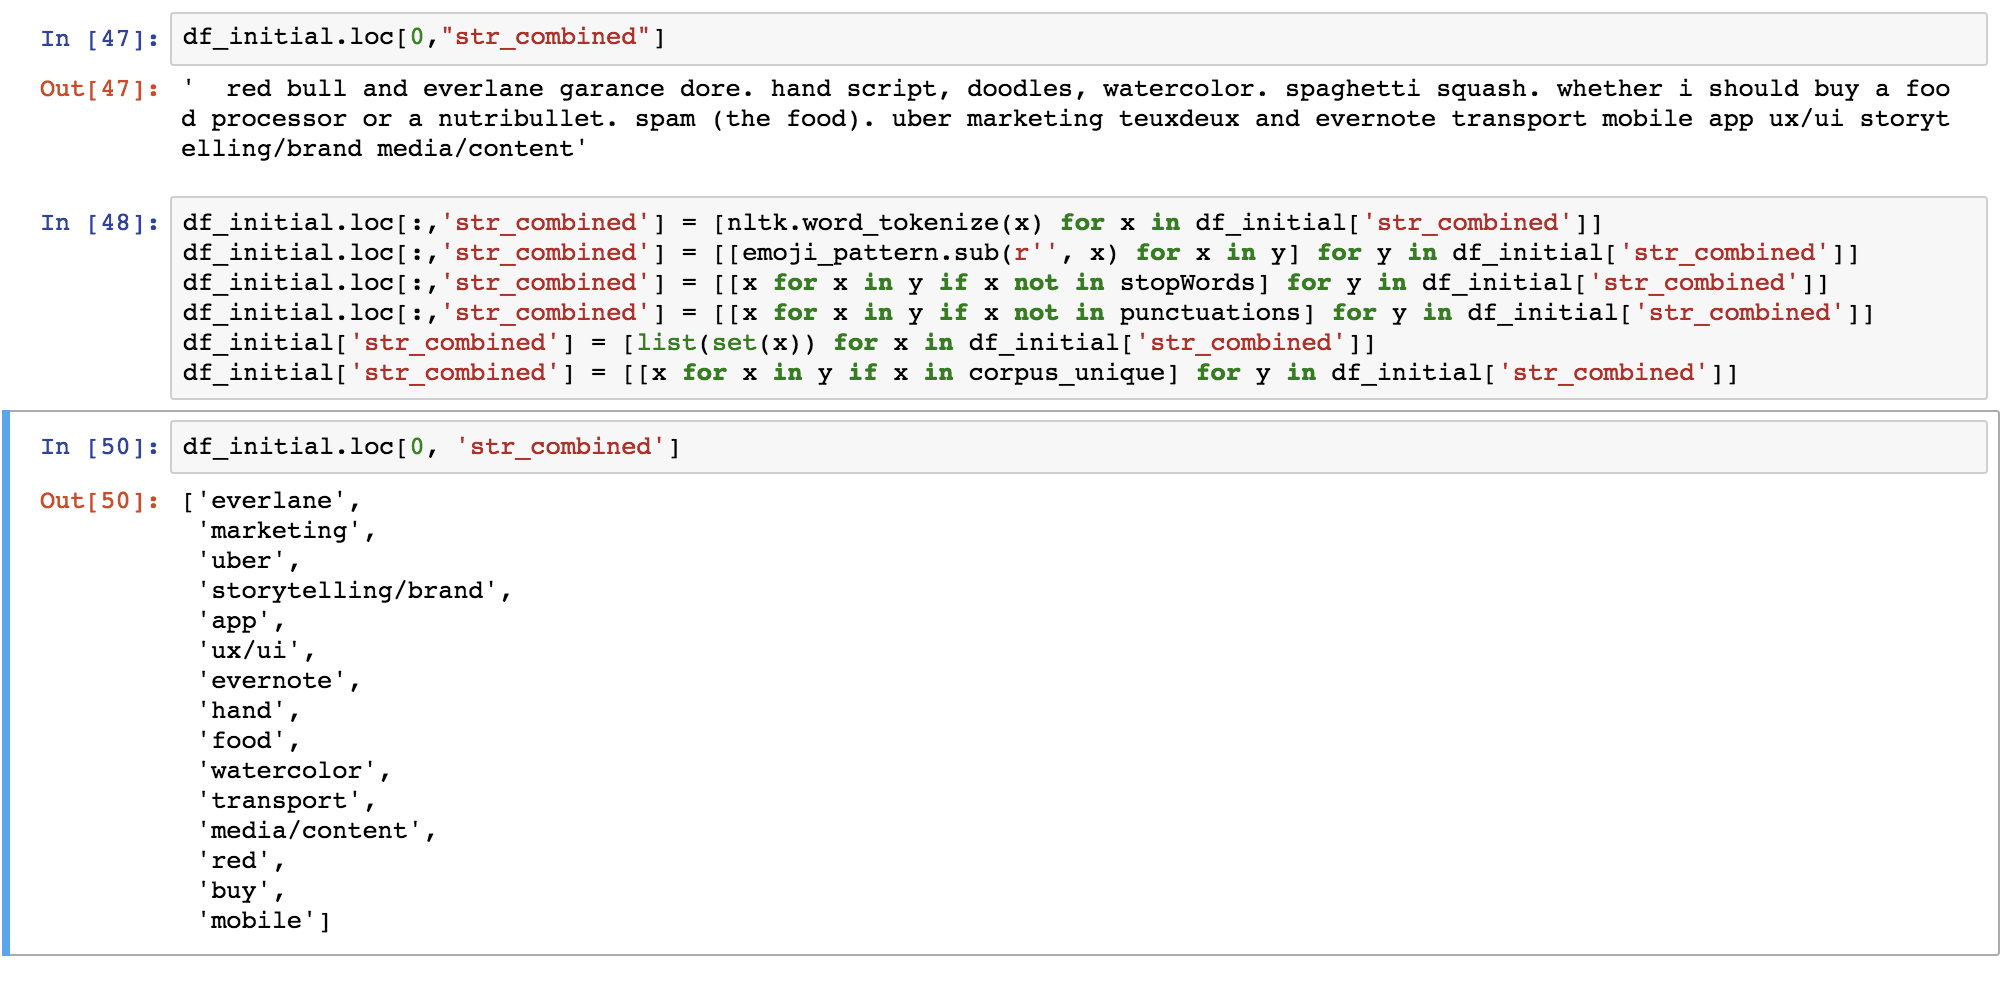
We did Natural Language Processing on the text inputs by first combining all the text fields of all users together. After this, we used the NLTK package of Python to tokenize the words. Then, we removed emoticons, stopwords, and punctuation. Next, we applied lemmatization to the remaining words. The initial set words for 300+ users had 81,000 words, which fell to 54,000 words after the word processing. Lastly, we counted the occurrence of every unique word in the set and dropped the words which occurred less than five times.
We used the resulting list to filter the responses for each user.
III. Feature Importance
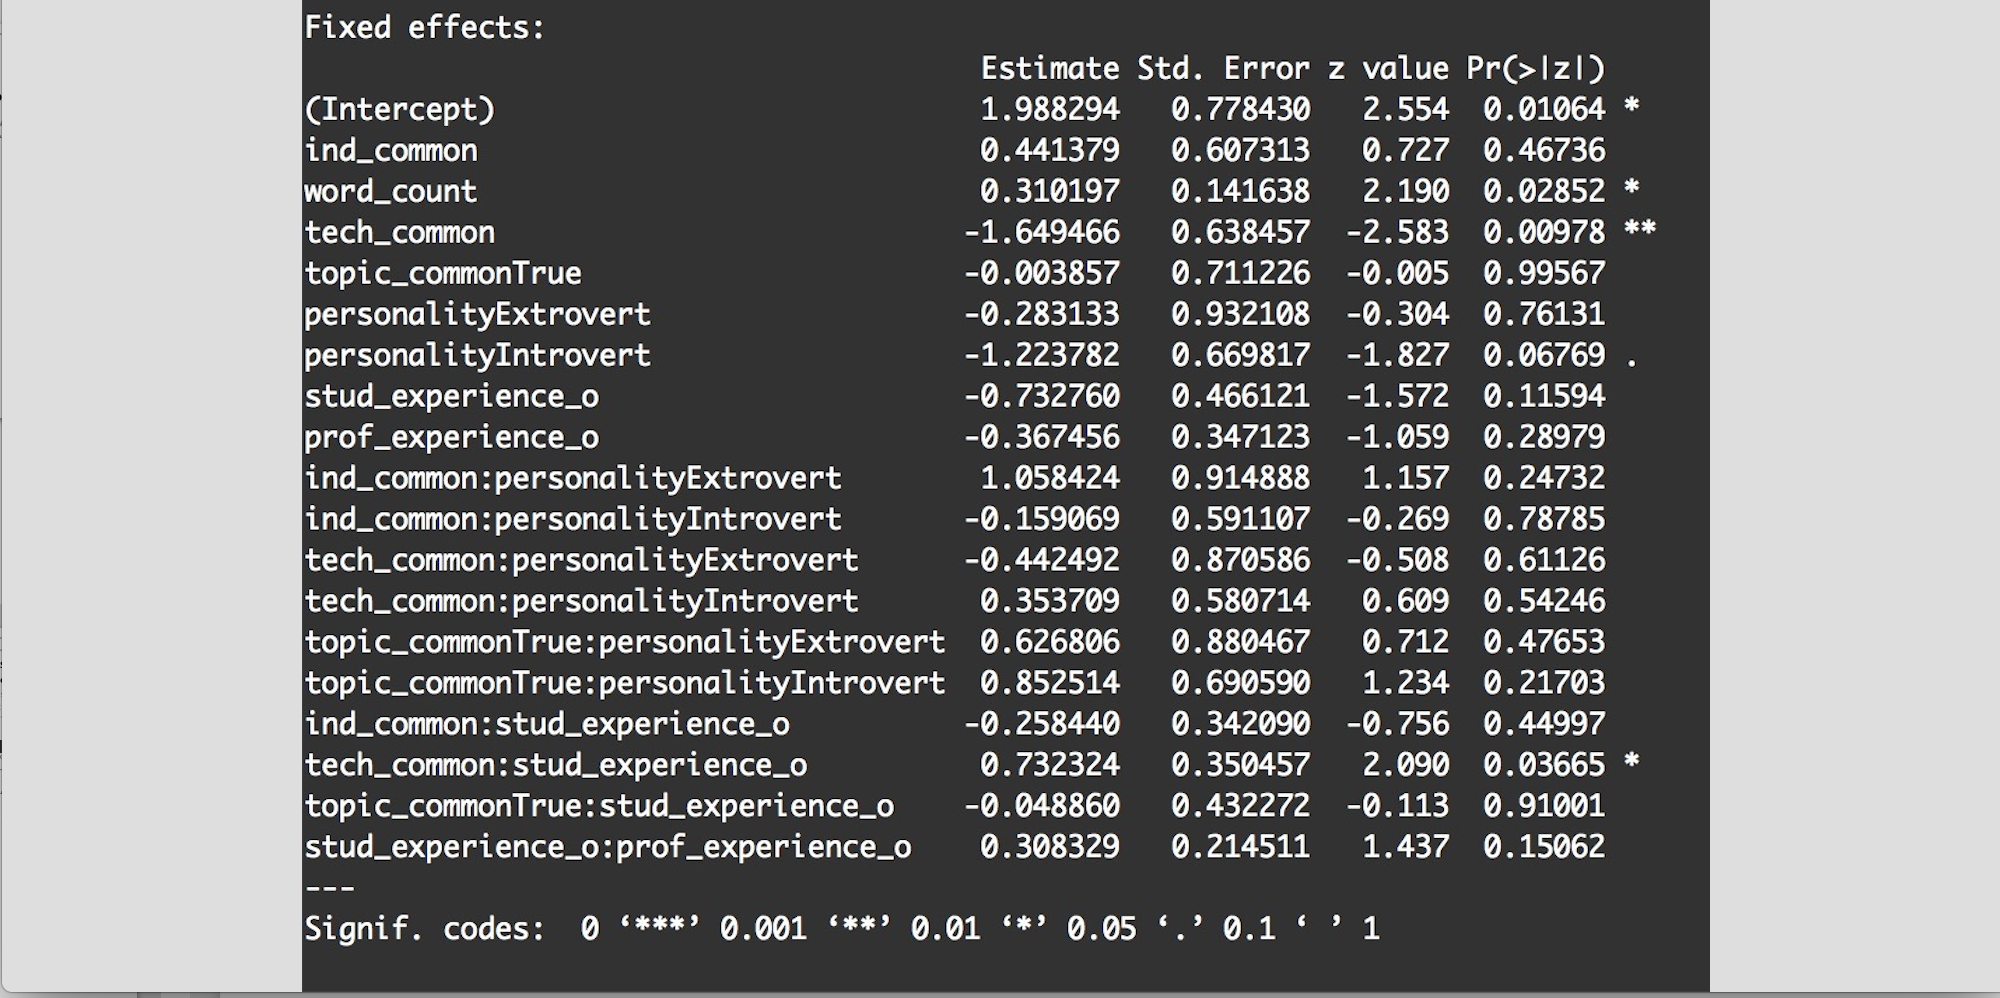
The group did a logistic regression on 18 features to determine which variable positively increased the chances of having a 5-star rating. The results showed that word_count, tech_common, and tech_common:stud_experience_o were the most significant variables. Just to give you an idea, word_count is the number of words that a student has in common with the professional, tech_common is a boolean that is true when the student has a common tech interest with the professional, and tech_common:stud_experience_o is a variable that combines the effect of tech_common and the level of education that the student has finished.
The outcome was expected because having more keywords in common means that the student and professional will have more things that they can talk about. This will increase the chance of an interesting conversation, which makes it more likely that the students will assign a high rating for the session.
IV. Match Scoring and Allocation Algorithm
There are two parts in the matching algorithm, namely, determining the score for all possible pairs and the allocation logic. We were able to calculate the match score both through logistic regression and K nearest neighbors.
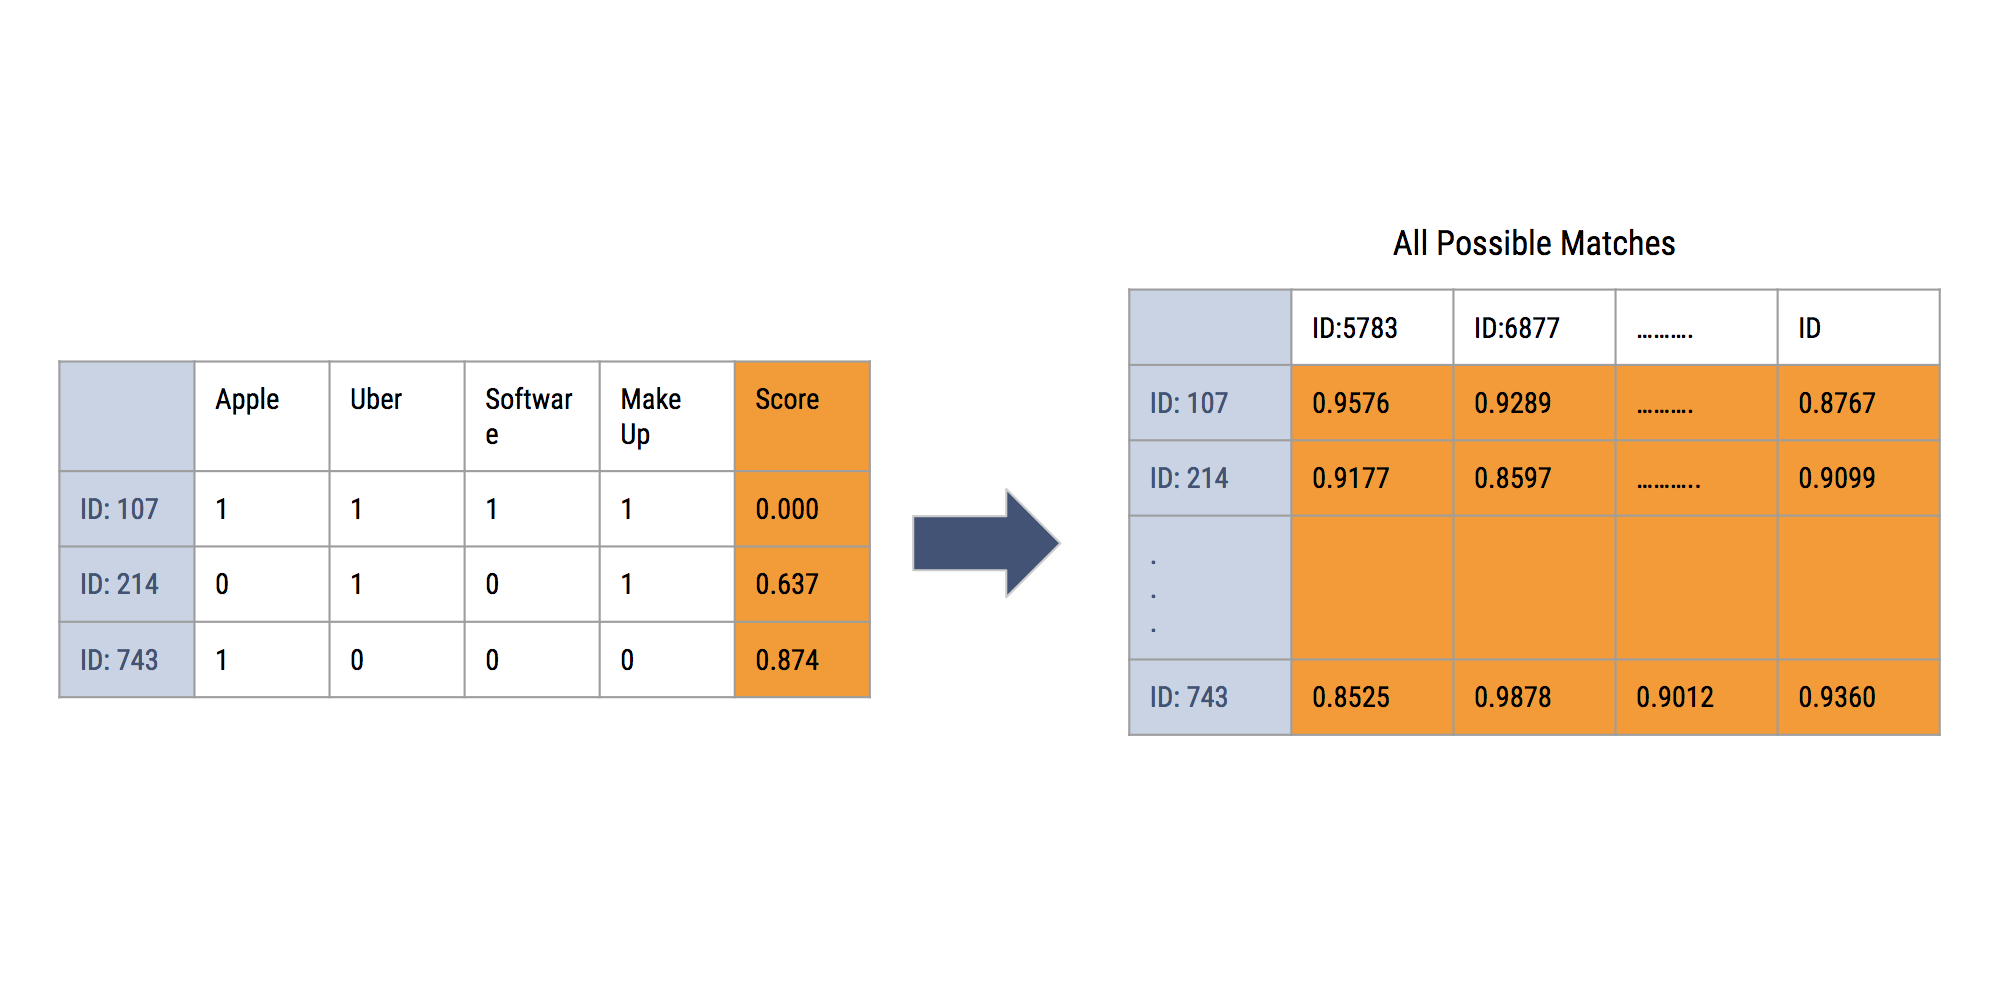
The logistic regression formula gives out a value from 0 to 1. This is the probability of getting the target result, which in our case, is the probability of having a 5-star rating. For our purposes, a higher probability is desired. For all possible pairs, a score is computed, which is then put in a matrix format. The way the data is formatted is important as this will be the raw data to be used for the pairing algorithm.
Now we’ll describe how we computed the scores using K Nearest neighbors. We were able to make a list of keywords per user in part II. This is going to be an input in the calculation of a score using K Nearest neighbors.
As shown above, for every user, a two-dimensional matrix is created with keywords of the user as columns and each user as the index. The words in common of a user with each other user will be determined using zeros and ones. The matrix is then used as input in the K Nearest neighbors function, which will then give a value which represents the distance between two people. The more similar the words are between two people, the lower the value will be. We standardized the values to be only in the range from 0 to 1. This means that the distance of a person to himself will be zero while the distance of a person with no word matches is one.
The matrix of scores for all possible pairs is then used to calculate possible matches based on certain conditions. An example of a condition is when we want a student and professional to come from the same city to allow their meetings to be convenient. The strictest set of conditions are applied first, and if a match is not found, the conditions will be slowly loosened until there is one.
A single user can have multiple pairs with the same best score. We used random sampling to select the person to pair. The randomization of pairing at that level of the code allows us to implement a Monte Carlo simulation to arrive at the best set of matches for a given universe of users.
V. Flask Dashboard
The dashboard contains visualizations of the data by batch, distributions by rating, word clouds of the common keywords, and a table of the users and the keywords that were generated for each of them. There is also an area where optimal matches can be viewed. The dashboard’s structure has a Jupyter notebook with Python code written on the back end, which generates CSV files. The CSV files are then processed by the front end Flask dashboard.
Here's a video demo of our dashboard. We hope you like it!
VI. Conclusion and Recommendations
The team has shown what the best determinants are for predicting a positive mentoring experience and developed an improved algorithm to pair mentees and mentors. Using the K-Nearest Neighbors method, the group improved the existing way that the matches were done. Given more data though, paring using logistic regression is the more robust and effective choice.


