NYC Data Science Academy| Blog
Bootcamps
Lifetime Job Support Available Financing Available
Bootcamps
Data Science with Machine Learning Flagship ๐Ÿ† Data Analytics Bootcamp Artificial Intelligence Bootcamp New Release ๐ŸŽ‰
Free Lesson
Intro to Data Science New Release ๐ŸŽ‰
Find Inspiration
Find Alumni with Similar Background
Job Outlook
Occupational Outlook Graduate Outcomes Must See ๐Ÿ”ฅ
Alumni
Success Stories Testimonials Alumni Directory Alumni Exclusive Study Program
Courses
View Bundled Courses
Financing Available
Bootcamp Prep Popular ๐Ÿ”ฅ Data Science Mastery Data Science Launchpad with Python View AI Courses Generative AI for Everyone New ๐ŸŽ‰ Generative AI for Finance New ๐ŸŽ‰ Generative AI for Marketing New ๐ŸŽ‰
Bundle Up
Learn More and Save More
Combination of data science courses.
View Data Science Courses
Beginner
Introductory Python
Intermediate
Data Science Python: Data Analysis and Visualization Popular ๐Ÿ”ฅ Data Science R: Data Analysis and Visualization
Advanced
Data Science Python: Machine Learning Popular ๐Ÿ”ฅ Data Science R: Machine Learning Designing and Implementing Production MLOps New ๐ŸŽ‰ Natural Language Processing for Production (NLP) New ๐ŸŽ‰
Find Inspiration
Get Course Recommendation Must Try ๐Ÿ’Ž An Ultimate Guide to Become a Data Scientist
For Companies
For Companies
Corporate Offerings Hiring Partners Candidate Portfolio Hire Our Graduates
Students Work
Students Work
All Posts Capstone Data Visualization Machine Learning Python Projects R Projects
Tutorials
About
About
About Us Accreditation Contact Us Join Us FAQ Webinars Subscription An Ultimate Guide to
Become a Data Scientist
    Login
NYC Data Science Acedemy
Bootcamps
Courses
Students Work
About
Bootcamps
Bootcamps
Data Science with Machine Learning Flagship
Data Analytics Bootcamp
Artificial Intelligence Bootcamp New Release ๐ŸŽ‰
Free Lessons
Intro to Data Science New Release ๐ŸŽ‰
Find Inspiration
Find Alumni with Similar Background
Job Outlook
Occupational Outlook
Graduate Outcomes Must See ๐Ÿ”ฅ
Alumni
Success Stories
Testimonials
Alumni Directory
Alumni Exclusive Study Program
Courses
Bundles
financing available
View All Bundles
Bootcamp Prep
Data Science Mastery
Data Science Launchpad with Python NEW!
View AI Courses
Generative AI for Everyone
Generative AI for Finance
Generative AI for Marketing
View Data Science Courses
View All Professional Development Courses
Beginner
Introductory Python
Intermediate
Python: Data Analysis and Visualization
R: Data Analysis and Visualization
Advanced
Python: Machine Learning
R: Machine Learning
Designing and Implementing Production MLOps
Natural Language Processing for Production (NLP)
For Companies
Corporate Offerings
Hiring Partners
Candidate Portfolio
Hire Our Graduates
Students Work
All Posts
Capstone
Data Visualization
Machine Learning
Python Projects
R Projects
About
Accreditation
About Us
Contact Us
Join Us
FAQ
Webinars
Subscription
An Ultimate Guide to Become a Data Scientist
Tutorials
Data Analytics
  • Learn Pandas
  • Learn NumPy
  • Learn SciPy
  • Learn Matplotlib
Machine Learning
  • Boosting
  • Random Forest
  • Linear Regression
  • Decision Tree
  • PCA
Interview by Companies
  • JPMC
  • Google
  • Facebook
Artificial Intelligence
  • Learn Generative AI
  • Learn ChatGPT-3.5
  • Learn ChatGPT-4
  • Learn Google Bard
Coding
  • Learn Python
  • Learn SQL
  • Learn MySQL
  • Learn NoSQL
  • Learn PySpark
  • Learn PyTorch
Interview Questions
  • Python Hard
  • R Easy
  • R Hard
  • SQL Easy
  • SQL Hard
  • Python Easy
Data Science Blog > Big Data > Data Study on NYC's Seven Major Felonies

Data Study on NYC's Seven Major Felonies

Michael Goldman
Posted on Feb 5, 2018
The skills the author demoed here can be learned through taking Data Science with Machine Learning bootcamp with NYC Data Science Academy.
Illustration by Greg Groesch/The Washington Times

My Motivation

Even though people in New York City are street-smart, crime is always a possibility and certain areas are more dangerous than others. But where are these unsafe areas? What crimes are taking place and when are they happening? Using NYPDโ€™s Historic Complaint data-set, I decided to look into these questions. The application can be found on my ShinyApps.io page. The code used to create and run the application can be found on my Github.

Note: Unfortunately due to ShinyApps.io limitations and the size of the dataset, I had to limit my data so that it could be hosted on its servers.


The Questions

As I was envisioning the app, I thought of 6 questions that I wanted my app to answer:

  1. Where do crimes occur and what are they?
  2. How have crime rates, after controlling for population, changed from 2006 to 2016?
  3. Which months are crimes more likely to occur?
  4. Do certain crimes occur more frequently on weekends or weekdays?
  5. Is time of day a factor in the frequency of crimes?
  6. Do any of these factors differ between boroughs?


The Data Set

Where it Came From:

I used the NYPD Historic Complaint Data, which includes information on all felonies, misdemeanors, and violations that have been reported to the NYPD from the start of 2006 to the end of 2016. The data set included information about the crime, such as the date, time, a description of the crime committed, and the location of the incident (including latitude and longitude). I focused on seven major felonies that occur in NYC: Murder, Rape, Felony Assault, Grand Larceny, Grand Larceny of Motor Vehicle, Robbery, and Burglary.

I also knew, when looking at the crime rates for each borough, I would have to control for population. In order to do this, I found the NYC borough population for 2010 and its estimate for 2016. In order to estimate the population for the missing years, I used the logistic growth formula.

Cleaning the Data:

When I first downloaded the dataset, there were around 5.6 million observations. I initially filtered the rows to include just the seven offenses I was focusing on. After inspecting the data, I noticed that a number of the offenses had missing labels or were labeled inaccurately (e.g.: the rowโ€™s three digit code did not match the listed offense description). I went through the data and made sure what I was collecting was accurate and inclusive.

After making the appropriate edits to include and correct for these entries, I created helper columns to provide additional filtering for the mapping and statistics of these crimes. I also consolidated information together from certain columns to add information to the maps, and dropped the unnecessary variables that were no longer needed. Once my data was cleaned, having just over 1.2 million observations, I added in my estimated population to the cleaned file. Once I had my data, I began coding the shiny app.


Data Visualizations and Statistics:

The Cluster Map:

Data Study on NYC's Seven Major Felonies

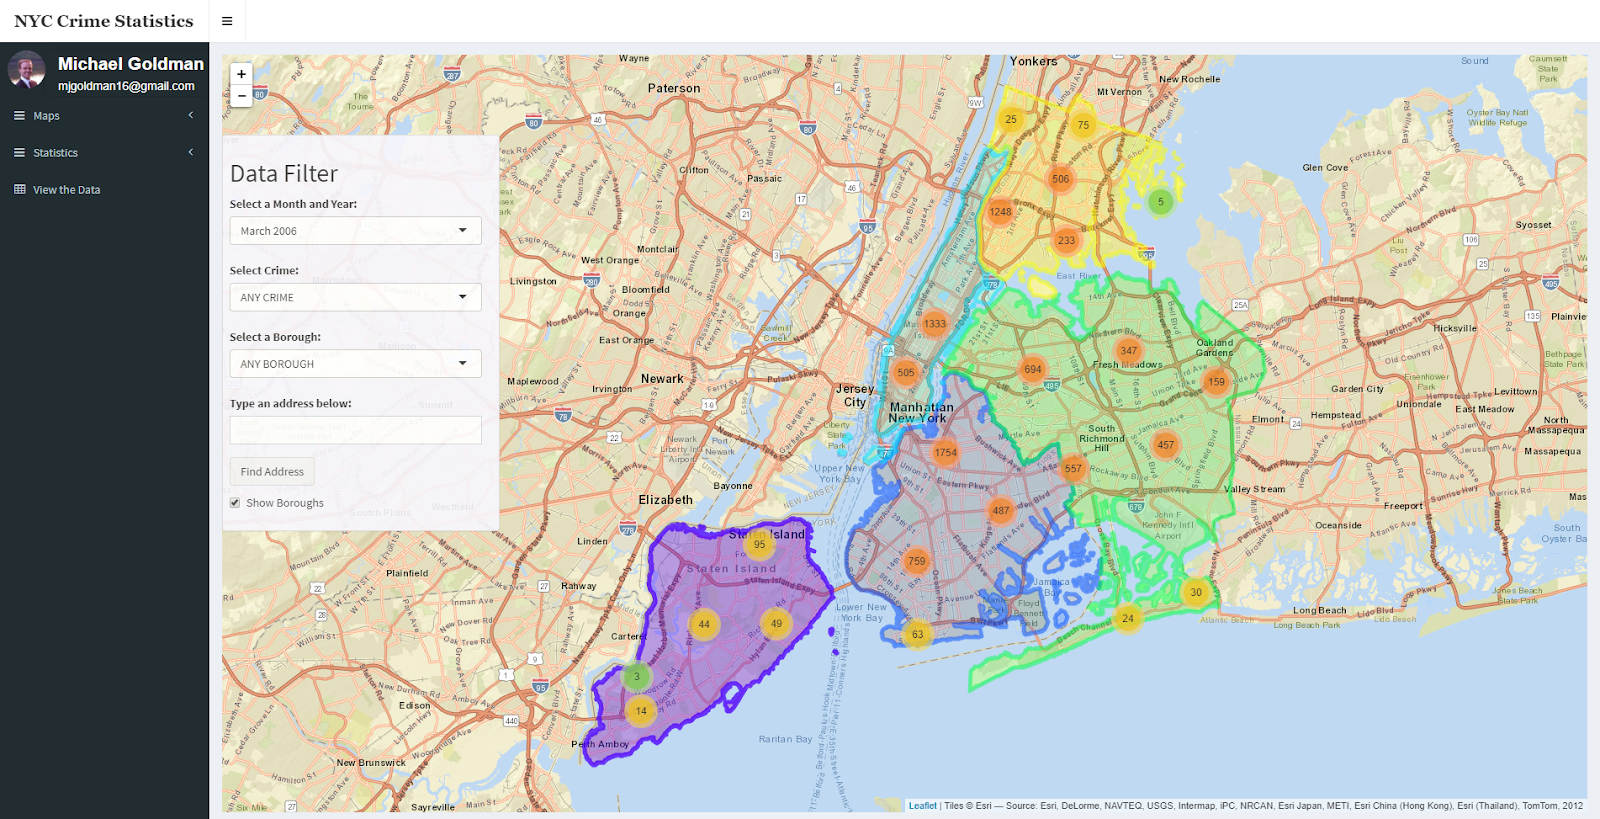
The cluster map allows the user to see the location and details of specific crimes by filtering based on month and year, type and by the borough. As you zoom into a location, the clusters move apart. If you zoom in enough, you are able to see individual pinpoints on where specific crimes occurred for that time frame.


Data Study on NYC's Seven Major Felonies

The icons are color coordinated based on crime type, making it easier to see what types of crimes occur near them when they do not have a specific crime filter set. If you click on a crime pinpoint, information appears stating the type of crime that was committed, where the incident occurred, and when it happened.


Data Study on NYC's Seven Major Felonies

In order to help a person find crime in a specific area, I add an address lookup feature. This allows users to quickly focus their search to specific areas, rather than have to zoom in and constantly having to orient themselves to find their area of interest. 


The Heat Map:

In order to provide a more high-level overview on where crimes occur in the borough, I created a heat map. Although you are not able to see the specific details about each individual crime, it lets the user know generally where crimes occur and how the location changes as time passes.  The map can be filtered with the same specifications as the cluster map.


Crime Trends Based on Crime Type and Borough 

When I started the assignment, I wanted to accomplish two tasks in terms of statistics. I wanted to be able compare trends of specific crimes within each borough, as well as see if a specific crime differed between borough. In order to accomplish this, I created two statistics tabs, focusing on each question specifically. Both tabs provide information on the overall trend of crimes, per 10,000 residents, as well as the frequency that specific crimes occur within various months, day of the weeks, or time of day.

Comparing Crimes Within a Borough:


In this tab, you can pick a borough to focus on and  see how the crime rates compare within each borough. The graphs measure the total amount of crimes that occurred within that time factor (year, month, day of the week, or time) and displays how the percentages changes. So for the example above, we can see that the number of  felony assaults in Staten Island have been increasing, per 10,000 residents, while the number of grand larcenies have been staying the same, despite a dip for the years 2009 - 2011.

Grand larceny also appears to increase as the year goes on, while assaults are more frequent in the spring and early summer. We can also see that assaults are  more likely to occur on the weekends, while grand larceny is more frequent during the week days. The final notable takeaway from this example is that felony assaults are more frequent in the early morning and late evening, while grand larceny generally occurs in the late morning to early evening.

Comparing Boroughs for a Specific Crime

In this tab, we can compare specific crimes and whether or not there are significant differences between the borough.  So for this example, we can see the number of robberies have been going down for almost all the boroughs, with the exception being Staten Island. However, we can also see that the likelihood that robberies take place, controlling for months, days of the week and time of day, don't appear to differ very much between boroughs. 


Viewing the Data

On the final tab, you can view the underlying data, filtering based on the types of crimes, the day of the week, the time of day, as well as for specific boroughs. Similar to cluster map, it provides you with the date the crime was committed, the time of day, the type of crime, and where it occurs. You can filter the data based on these categories as well.


Further Exploration

As I continue to add onto this application, I would like to include information about the income distribution for each borough. I would also like to look into whether educational spending has an impact on crimes rates within each borough. I also would like to add weather as a factor that I could potentially control for, seeing its impact on crime rates. This app is only for trends and analysis, but I add more data to the application, I would like to run regressions, measuring the effects of income inequality, education spending, and gentrification on crime rates for each borough.

About Author

Michael Goldman

Michael Goldman is an experienced data analyst with a background in economics, mathematics, and computer science (Python, R, SQL, Stata, Java, and VBA). He has worked as a Data Analyst for NERA Economic Consulting, providing expert testimony and...
View all posts by Michael Goldman >

Related Articles

Machine Learning
Accurately Predicting House Prices and Improving Client Experience with Machine Learning
Big Data
Data Driven Rebalancing of Citi Bike Operations
Python
Data Analysis on The Effect of Inflation on Primary Assets
Big Data
House Price Prediction with Creative Feature Engineering and Advanced Regression Techniques
Big Data
Data Visualization on under-rated hiking destinations

Leave a Comment

Cancel reply

You must be logged in to post a comment.

No comments found.

View Posts by Categories

All Posts 2399 posts
AI 7 posts
AI Agent 2 posts
AI-based hotel recommendation 1 posts
AIForGood 1 posts
Alumni 60 posts
Animated Maps 1 posts
APIs 41 posts
Artificial Intelligence 2 posts
AWS 13 posts
Banking 1 posts
Big Data 50 posts
Branch Analysis 1 posts
Capstone 206 posts
Career Education 7 posts
CLIP 1 posts
Community 72 posts
Congestion Zone 1 posts
Content Recommendation 1 posts
Cosine SImilarity 1 posts
Data Analysis 5 posts
Data Engineering 1 posts
Data Engineering 3 posts
Data Science 7 posts
Data Science News and Sharing 73 posts
Data Visualization 324 posts
Events 5 posts
Featured 37 posts
Function calling 1 posts
FutureTech 1 posts
Generative AI 5 posts
Hadoop 13 posts
Image Classification 1 posts
Innovation 2 posts
Kmeans Cluster 1 posts
LLM 6 posts
Machine Learning 364 posts
Marketing 1 posts
Meetup 144 posts
MLOPs 1 posts
Model Deployment 1 posts
Nagamas69 1 posts
NLP 1 posts
OpenAI 5 posts
OpenNYC Data 1 posts
pySpark 1 posts
Python 16 posts
Python 458 posts
Python data analysis 4 posts
Python Shiny 2 posts
R 404 posts
R Data Analysis 1 posts
R Shiny 560 posts
R Visualization 445 posts
RAG 1 posts
RoBERTa 1 posts
semantic rearch 2 posts
Spark 17 posts
SQL 1 posts
Streamlit 2 posts
Student Works 1687 posts
Tableau 12 posts
TensorFlow 3 posts
Traffic 1 posts
User Preference Modeling 1 posts
Vector database 2 posts
Web Scraping 483 posts
wukong138 1 posts

Our Recent Popular Posts

AI 4 AI: ChatGPT Unifies My Blog Posts
by Vinod Chugani
Dec 18, 2022
Meet Your Machine Learning Mentors: Kyle Gallatin
by Vivian Zhang
Nov 4, 2020
NICU Admissions and CCHD: Predicting Based on Data Analysis
by Paul Lee, Aron Berke, Bee Kim, Bettina Meier and Ira Villar
Jan 7, 2020

View Posts by Tags

#python #trainwithnycdsa 2019 2020 Revenue 3-points agriculture air quality airbnb airline alcohol Alex Baransky algorithm alumni Alumni Interview Alumni Reviews Alumni Spotlight alumni story Alumnus ames dataset ames housing dataset apartment rent API Application artist aws bank loans beautiful soup Best Bootcamp Best Data Science 2019 Best Data Science Bootcamp Best Data Science Bootcamp 2020 Best Ranked Big Data Book Launch Book-Signing bootcamp Bootcamp Alumni Bootcamp Prep boston safety Bundles cake recipe California Cancer Research capstone car price Career Career Day ChatGPT citibike classic cars classpass clustering Coding Course Demo Course Report covid 19 credit credit card crime frequency crops D3.js data data analysis Data Analyst data analytics data for tripadvisor reviews data science Data Science Academy Data Science Bootcamp Data science jobs Data Science Reviews Data Scientist Data Scientist Jobs data visualization database Deep Learning Demo Day Discount disney dplyr drug data e-commerce economy employee employee burnout employer networking environment feature engineering Finance Financial Data Science fitness studio Flask flight delay football gbm Get Hired ggplot2 googleVis H20 Hadoop hallmark holiday movie happiness healthcare frauds higgs boson Hiring hiring partner events Hiring Partners hotels housing housing data housing predictions housing price hy-vee Income industry Industry Experts Injuries Instructor Blog Instructor Interview insurance italki Job Job Placement Jobs Jon Krohn JP Morgan Chase Kaggle Kickstarter las vegas airport lasso regression Lead Data Scienctist Lead Data Scientist leaflet league linear regression Logistic Regression machine learning Maps market matplotlib Medical Research Meet the team meetup methal health miami beach movie music Napoli NBA netflix Networking neural network Neural networks New Courses NHL nlp NYC NYC Data Science nyc data science academy NYC Open Data nyc property NYCDSA NYCDSA Alumni Online Online Bootcamp Online Training Open Data painter pandas Part-time performance phoenix pollutants Portfolio Development precision measurement prediction Prework Programming public safety PwC python Python Data Analysis python machine learning python scrapy python web scraping python webscraping Python Workshop R R Data Analysis R language R Programming R Shiny r studio R Visualization R Workshop R-bloggers random forest Ranking recommendation recommendation system regression Remote remote data science bootcamp Scrapy scrapy visualization seaborn seafood type Selenium sentiment analysis sentiment classification Shiny Shiny Dashboard Spark Special Special Summer Sports statistics streaming Student Interview Student Showcase SVM Switchup Tableau teachers team team performance TensorFlow Testimonial tf-idf Top Data Science Bootcamp Top manufacturing companies Transfers tweets twitter videos visualization wallstreet wallstreetbets web scraping Weekend Course What to expect whiskey whiskeyadvocate wildfire word cloud word2vec XGBoost yelp youtube trending ZORI

NYC Data Science Academy

NYC Data Science Academy teaches data science, trains companies and their employees to better profit from data, excels at big data project consulting, and connects trained Data Scientists to our industry.

NYC Data Science Academy is licensed by New York State Education Department.

Get detailed curriculum information about our
amazing bootcamp!

Please enter a valid email address
Sign up completed. Thank you!

Offerings

  • HOME
  • DATA SCIENCE BOOTCAMP
  • ONLINE DATA SCIENCE BOOTCAMP
  • Professional Development Courses
  • CORPORATE OFFERINGS
  • HIRING PARTNERS
  • About

  • About Us
  • Alumni
  • Blog
  • FAQ
  • Contact Us
  • Refund Policy
  • Join Us
  • SOCIAL MEDIA

    ยฉ 2025 NYC Data Science Academy
    All rights reserved. | Site Map
    Privacy Policy | Terms of Service
    Bootcamp Application