Scraping Box Office Mojo
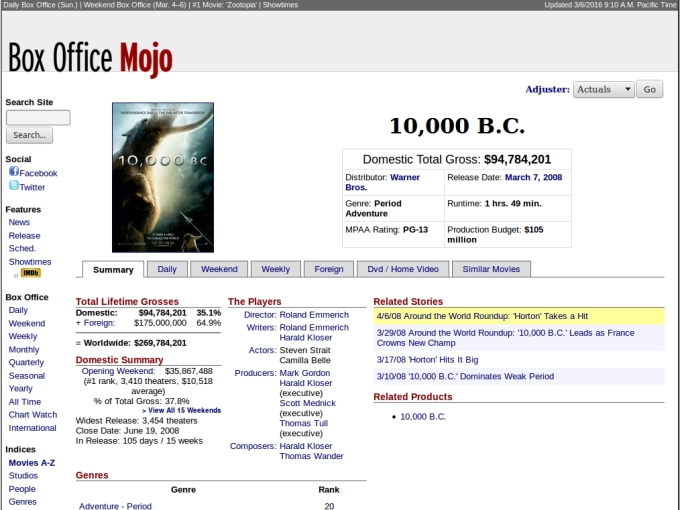
Before joining the NYC Data Science Academy, I took on a small project of my own to play around with some of Python's more data science related modules. I scraped every movie page on Box Office Mojo using Beautiful Soup and urllib2, and then did some simple analysis using NumPy, Pandas and scikit-learn. The full code is available on my GitHub.
Box Office Mojo is a good site to practice scraping because it is (more or less) well organized so that a simple procedure can be repeated to scrape many pages with few exceptions.
I started by generating the list of movies I want to scrape, I do this by starting from the alphabetical index of movies on the site.
![]()
The python script, bom.py generates a list of links, each link leading to a different movie's page. Once all the movies on a given page have been added to the list, the script will go to the next page for that letter (if it exists). Once all pages for a given letter are exhausted, the scraper moves to the next letter.
 The "urlopen_with_retry" part is just a small modification to urlopen from urllib2 that adds retrying behavior; we don't want the whole scraper to fail if one of the many pages we navigate to is a little slow to load.
The "if__name__=="main" part is used to specify which thread will generate the list of movies, because this scraping process can be sped up a little if I divide it up among threads for parallel processing using the multiprocessing module for python.

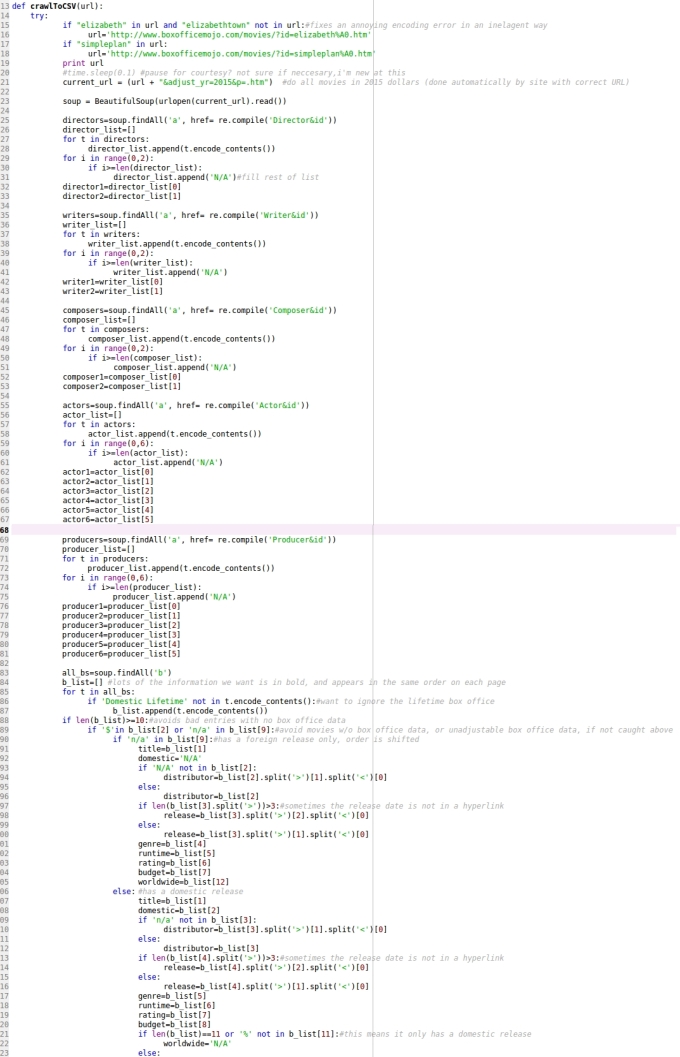
Once we have the list of all movie links, the script runs through the whole list and for each movie page I scrape just a subset of the data on the page that I am interested in.

From each movie page I scrape the title, domestic and world wide box office, the budget, the genre, a list of actors, directors, writers, producers and composers, as well as the rating, distributor, release date and runtime. Some of this code is straight forward, but the records on Box Office Mojo aren't perfectly uniform and some of the exceptions need to be handled here.

Finally, each movie's data is saved as a row in a CSV. Alternatively this can be saved to an SQL database instead; both versions of the code are available on my GitHub.

When everything is finished I have a CSV with data on about 13,000 movies and there are many things I can do with this data, but I just do two simple explorations here.
In movie_project1.py, I look at the relationship between a movie's domestic release date and average domestic box office, and then I go a little bit further and break this down by genre. The first step is to store the CSV data that I scraped into a Pandas data frame, as this is a bit easier to manipulate. The next few steps are some simple data cleaning (removing foreign only releases, forcing dates and dollar amounts to usable formats).

After these basic cleaning steps, I still need to clean up the genres a little. There is a lot of overlap in the genres as listed by Box office Mojo, (i.e. romantic comedy, sci-fi horror). My approach was to count a movie with overlapping genres multiple times, so if a movie is considered both comedy and animation, then it will show up twice, once in comedy and once in animation.

After sorting out the genres, I group the films by their weekend of release, calculate the average box office for each of these groups, and then rescale these averages so that I can show several genres on the same graph at the same scale.

After these steps I plot the results for just a few genres and an inclusive category (I don't want to over clutter my graphic). There are many options for visualization/plotting in python, and for this visualization I decided to go with visvis to make a nice little 3D plot of my results.

Looking at the blue bars (all domestic films), the results are mostly what I would expect from my layman's knowledge of the film industry. We see a big lump in the summer months when block busters are released and more people are seeing movies, and then we see another sharp spike in the holidays, Thanksgiving and Christmas. Breaking it down by genre we see mostly the same pattern, but the data is a little more sparse now. There are a few small surprises when looking at it by genre: fantasy has a very large spike mid-summer, animation has a large spike that is absent in the other genres and romance spikes in the holiday season more strongly than other genres but there is no additional spike on Valentine's day which I might have expected.
My other small analysis was with some of the film maker data. In movie_project2.py I look at how the choice of director(s) and writer(s) can affect the domestic box office of a movie.
Again this requires some cleaning steps, as in movie_project1.py.
For each writer/director I assigned a score based on the scaled average domestic box office of their entire body of work. Each movie from box office mojo can then be assigned a director score and writer score. In cases where a film had more than one writer or more than one director I used the average of scores.
I can then make a 3D scatter plot of all the movies I scraped, showing how the two scores relate to the average box office. We can go a bit further and fit a plane to this scatter plot with multiple linear regression.

Intuitively it is obvious that better writers/directors will result in a larger box office return (the score is just based on their previous box office track record after all) but what is surprising is how much spread there is in the box office returns of films with a high writer/director score. If I come back to this later to do something more involved I think I would want to look at box office scaled by budget instead, as I think this would tighten up the points around the plane and make a model of the writer's/director's impact on the box office more meaningful. The very low points with a large writer director score can easily be explained, as not necessarily bad films, but perhaps more artistic, smaller budget films that successful writers and directors take on.

