Tree Troubles -- Predicting Sidewalk Damage Resulting From Trees In NYC

Posted on Dec 21, 2016

Introduction

Tree roots growing under sidewalks often cause cracking or lifting of the pavement once the tree surpasses a certain size. This creates significant tripping hazards for pedestrians, and liability issues for property owners. Furthermore, the cost of repairing such damage is in excess of $100 million per year in the United States. As such, this project seeks to:

  • Predict the likelihood that a particular tree will result in sidewalk damage.
  • Elucidate the factors most involved in causing such damage.
  • Develop application to help recommend trees species and other steps to reduce the likelihood of future sidewalk damage.

Dataset

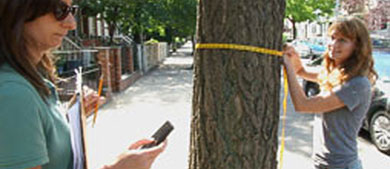
In 2015 NYC conducted volunteer-powered campaign to map, count, and care for all of the city's street trees. This dataset consist of:

  • 432,564 Live Tree
  • 14,099 Dead Tree
  • 40% Sidewalk Damage
  • Average DBH of 11.6 inches
  • 132 Different Species

The ultimate dataset consisted of the following features "tree_id", "year", "tree_dbh", "health", "spc_latin", "spc_common", "root_stone", "root_grate", "root_other", "trunk_wire", "address", "zipcode",  "boro_name", "longitude", "latitude", "block_code", "sidewalk". Details on these terms can be found at the dataset link above. 

Technology Pipeline

tech_pipeline

The technology employed is a mixture of Python, R, and Java. Python scripts are used for performing data cleaning and merging, as well as web scraping tree species data from leafsnap.com. R scripts are used for performing numerical and visual EDA and for running machine learning algorithms.  For the desktop analysis application and to generate heatmaps (see below), Java is used.  Java will also be used to develop a mobile application.

Visual Overview Of Data

trees_tree_dbh

In order to quickly check for a relationship between tree diameter and sidewalk damage a heatmap is generated by sorting the data by increasing diameter (from 3 to 70 inches). The magenta color represents the different species of trees. The red and greens pixels represent "damage" or "no damage" to the sidewalk respectively. One key takeaway here is that there isn't an obvious relationship between sidewalk condition and tree diameter. Another take away is that even though there are 132 tree species in the dataset, only a small number make up most of the trees planted (see bar plot below).

barplot

Variable Association

The associations between the predictor variables in the dataset and sidewalk condition is also compared using either a Cramers V function or the ICC package in R.  The strength of association ranges from 0 to 1, with a value of 1 indicating perfect association between two variables.

association

Clustering (Unsupervised Learning)

Clustering was done by first generating a dissimilarity matrix using the “gower” distance, then using the “pam” function to find the best number of clusters. Using sample datasets (1000 obs) containing all the geolocation related features (i.e. address, zipcode, boro name, longitude, latitude), the optimal number of clusters found is 6. These clusters more or less corresponds to the boro the trees are located in. See image below.cluster_6

Removing all geolocation related features, with the exception of longitude and latitude, the optimal number of cluster is now found to be 2 which corresponds to the sidewalk condition of either damage or not damaged.

cluster_2

Classification (Supervised Learning)

The R Caret package was used to run various machine learning classification algorithms on full dataset using the typical 80/20 (train/test) split validation method. The accuracy results are outlined below.

  • Logistic Regression
    • GLM: 75.8%
    • GLMNet: 75.8%
  • KNN: 76.9%
  • Naive Bayes: 73.2%
  • Tree Based Classification
    • GBM: 77.3%
    • XGBoost: 77.9%
  • SVM (radial kernel): 77.1%
  • Neural Net: 77.4%

Overall, the accuracy results for these algorithms was fairly close and given the nature of the problem, simple the Logistic Regression models were found to be well suited for use in the analysis application described below.  As for what features are most important in determine sidewalk damage, both the tree based and logistics regression models are in overall agreement that having blocks around the trees (root_stone), tree diameter, and location play important roles.fimportance

Analysis Application “NYC Tree Insights”

In order to make the models useful for use by non technical users, a desktop applications that performs analysis on the “dead trees” data to predict the potential for sidewalk damage at various years (10, 20, 30, 50, 75) in the future is has been developed.

application1

Additionally, the application also allows for rapid visual analysis by making use of bar plots and links to Google Maps to view the area and even the dead tree in question.

application2

Conclusion

By making use of the NYC 2015 Tree Census dataset, a classification model, with an accuracy of over 75% in predicting root induced sidewalk damage was developed.  Moreover, a Java based desktop application was developed around this model to help stake holders assess the likelihood sidewalk damage in the future if a certain species of tree is planted at a particular location.  The next steps for this project are:

  • Migrate machine learning backend to Amazon services
  • Create web application
  • Create mobile application

About Author

Nathan Stevens

Nathan holds a Ph.D. in Nanotechnology and Materials Science from the City University of New York graduate school, and has worked on numerous software and scientific research projects over the last 10 years. Software projects have ranged from...
View all posts by Nathan Stevens >

Related Articles

Leave a Comment

Mayor de Blasio To Stop Issuing Violations On Homeowners For Damages Caused By Street Trees September 10, 2019
[…] Photo credit: Via source. […]
tag heuer watches ladies fake January 3, 2017
-The very first Commandment regarding Head of the family Galen tag heuer watches ladies fake http://www.watchheuer.ru/
ballon bleu de cartier copie January 3, 2017
Entiendo tu punto, cuando eres un usuario windows y pruebas otros sistemas operativos no entiendes casi nada, aunque hay que recordar que creciste usando windows has seguido sus actualizaciones, en pocas palabras ya lo conoces. Pero es lo mismo con los idiomas, tu creciste hablando español, (eso creo, de no ser así vamos a suponerlo) cuando quieres aprender a hablar otro idioma como el Japones al inicio no entiendes ni lo que estas aprendiendo, pero pasado el tiempo te das cuenta que es mas facil y sencillo que el mismo español (salvo a la escritura). El punto es que si no les dedicas el tiempo la paciencia y la disciplina en aprender, y continuas pensando y emulando (que no es el termino) Windows jamas vas a aprender a usarlo realmente. Tengo un grupo de chavos (casi niños) que desde el inicio usaron Ubuntu y cada ves que usan Windows se quejan y mencionan “como es posible que la gente use esa cosa”. recuerda en linux tu eres el dueño de tu software, cosa que jamas seras en Windows o Os x. ballon bleu de cartier copie http://www.montrecartier.com/category/montre-ballon-bleu-de-cartier/
Tree Troubles — Predicting Sidewalk Damage Resulting From Trees In NYC – Mubashir Qasim December 22, 2016
[…] post Tree Troubles — Predicting Sidewalk Damage Resulting From Trees In NYC appeared first on NYC Data Science Academy […]
Tree Troubles — Predicting Sidewalk Damage Resulting From Trees In NYC | A bunch of data December 22, 2016
[…] post Tree Troubles — Predicting Sidewalk Damage Resulting From Trees In NYC appeared first on NYC Data Science Academy […]
Tree Troubles — Predicting Sidewalk Damage Resulting From Trees In NYC - Use-R!Use-R! December 22, 2016
[…] post Tree Troubles — Predicting Sidewalk Damage Resulting From Trees In NYC appeared first on NYC Data Science Academy […]

View Posts by Categories


Our Recent Popular Posts


View Posts by Tags

#python #trainwithnycdsa 2019 2020 Revenue 3-points agriculture air quality airbnb airline alcohol Alex Baransky algorithm alumni Alumni Interview Alumni Reviews Alumni Spotlight alumni story Alumnus ames dataset ames housing dataset apartment rent API Application artist aws bank loans beautiful soup Best Bootcamp Best Data Science 2019 Best Data Science Bootcamp Best Data Science Bootcamp 2020 Best Ranked Big Data Book Launch Book-Signing bootcamp Bootcamp Alumni Bootcamp Prep boston safety Bundles cake recipe California Cancer Research capstone car price Career Career Day citibike classic cars classpass clustering Coding Course Demo Course Report covid 19 credit credit card crime frequency crops D3.js data data analysis Data Analyst data analytics data for tripadvisor reviews data science Data Science Academy Data Science Bootcamp Data science jobs Data Science Reviews Data Scientist Data Scientist Jobs data visualization database Deep Learning Demo Day Discount disney dplyr drug data e-commerce economy employee employee burnout employer networking environment feature engineering Finance Financial Data Science fitness studio Flask flight delay gbm Get Hired ggplot2 googleVis H20 Hadoop hallmark holiday movie happiness healthcare frauds higgs boson Hiring hiring partner events Hiring Partners hotels housing housing data housing predictions housing price hy-vee Income Industry Experts Injuries Instructor Blog Instructor Interview insurance italki Job Job Placement Jobs Jon Krohn JP Morgan Chase Kaggle Kickstarter las vegas airport lasso regression Lead Data Scienctist Lead Data Scientist leaflet league linear regression Logistic Regression machine learning Maps market matplotlib Medical Research Meet the team meetup methal health miami beach movie music Napoli NBA netflix Networking neural network Neural networks New Courses NHL nlp NYC NYC Data Science nyc data science academy NYC Open Data nyc property NYCDSA NYCDSA Alumni Online Online Bootcamp Online Training Open Data painter pandas Part-time performance phoenix pollutants Portfolio Development precision measurement prediction Prework Programming public safety PwC python Python Data Analysis python machine learning python scrapy python web scraping python webscraping Python Workshop R R Data Analysis R language R Programming R Shiny r studio R Visualization R Workshop R-bloggers random forest Ranking recommendation recommendation system regression Remote remote data science bootcamp Scrapy scrapy visualization seaborn seafood type Selenium sentiment analysis sentiment classification Shiny Shiny Dashboard Spark Special Special Summer Sports statistics streaming Student Interview Student Showcase SVM Switchup Tableau teachers team team performance TensorFlow Testimonial tf-idf Top Data Science Bootcamp Top manufacturing companies Transfers tweets twitter videos visualization wallstreet wallstreetbets web scraping Weekend Course What to expect whiskey whiskeyadvocate wildfire word cloud word2vec XGBoost yelp youtube trending ZORI