NYC Data Science Academy| Blog
Bootcamps
Lifetime Job Support Available Financing Available
Bootcamps
Data Science with Machine Learning Flagship ๐Ÿ† Data Analytics Bootcamp Artificial Intelligence Bootcamp New Release ๐ŸŽ‰
Free Lesson
Intro to Data Science New Release ๐ŸŽ‰
Find Inspiration
Find Alumni with Similar Background
Job Outlook
Occupational Outlook Graduate Outcomes Must See ๐Ÿ”ฅ
Alumni
Success Stories Testimonials Alumni Directory Alumni Exclusive Study Program
Courses
View Bundled Courses
Financing Available
Bootcamp Prep Popular ๐Ÿ”ฅ Data Science Mastery Data Science Launchpad with Python View AI Courses Generative AI for Everyone New ๐ŸŽ‰ Generative AI for Finance New ๐ŸŽ‰ Generative AI for Marketing New ๐ŸŽ‰
Bundle Up
Learn More and Save More
Combination of data science courses.
View Data Science Courses
Beginner
Introductory Python
Intermediate
Data Science Python: Data Analysis and Visualization Popular ๐Ÿ”ฅ Data Science R: Data Analysis and Visualization
Advanced
Data Science Python: Machine Learning Popular ๐Ÿ”ฅ Data Science R: Machine Learning Designing and Implementing Production MLOps New ๐ŸŽ‰ Natural Language Processing for Production (NLP) New ๐ŸŽ‰
Find Inspiration
Get Course Recommendation Must Try ๐Ÿ’Ž An Ultimate Guide to Become a Data Scientist
For Companies
For Companies
Corporate Offerings Hiring Partners Candidate Portfolio Hire Our Graduates
Students Work
Students Work
All Posts Capstone Data Visualization Machine Learning Python Projects R Projects
Tutorials
About
About
About Us Accreditation Contact Us Join Us FAQ Webinars Subscription An Ultimate Guide to
Become a Data Scientist
    Login
NYC Data Science Acedemy
Bootcamps
Courses
Students Work
About
Bootcamps
Bootcamps
Data Science with Machine Learning Flagship
Data Analytics Bootcamp
Artificial Intelligence Bootcamp New Release ๐ŸŽ‰
Free Lessons
Intro to Data Science New Release ๐ŸŽ‰
Find Inspiration
Find Alumni with Similar Background
Job Outlook
Occupational Outlook
Graduate Outcomes Must See ๐Ÿ”ฅ
Alumni
Success Stories
Testimonials
Alumni Directory
Alumni Exclusive Study Program
Courses
Bundles
financing available
View All Bundles
Bootcamp Prep
Data Science Mastery
Data Science Launchpad with Python NEW!
View AI Courses
Generative AI for Everyone
Generative AI for Finance
Generative AI for Marketing
View Data Science Courses
View All Professional Development Courses
Beginner
Introductory Python
Intermediate
Python: Data Analysis and Visualization
R: Data Analysis and Visualization
Advanced
Python: Machine Learning
R: Machine Learning
Designing and Implementing Production MLOps
Natural Language Processing for Production (NLP)
For Companies
Corporate Offerings
Hiring Partners
Candidate Portfolio
Hire Our Graduates
Students Work
All Posts
Capstone
Data Visualization
Machine Learning
Python Projects
R Projects
About
Accreditation
About Us
Contact Us
Join Us
FAQ
Webinars
Subscription
An Ultimate Guide to Become a Data Scientist
Tutorials
Data Analytics
  • Learn Pandas
  • Learn NumPy
  • Learn SciPy
  • Learn Matplotlib
Machine Learning
  • Boosting
  • Random Forest
  • Linear Regression
  • Decision Tree
  • PCA
Interview by Companies
  • JPMC
  • Google
  • Facebook
Artificial Intelligence
  • Learn Generative AI
  • Learn ChatGPT-3.5
  • Learn ChatGPT-4
  • Learn Google Bard
Coding
  • Learn Python
  • Learn SQL
  • Learn MySQL
  • Learn NoSQL
  • Learn PySpark
  • Learn PyTorch
Interview Questions
  • Python Hard
  • R Easy
  • R Hard
  • SQL Easy
  • SQL Hard
  • Python Easy
Data Science Blog > Capstone > Utilizing Data to Predict and Characterize Healthcare Fraud

Utilizing Data to Predict and Characterize Healthcare Fraud

Augi Bold, Jesse Egoavil and Rupali Pahouja
Posted on Aug 2, 2021
The skills I demoed here can be learned through taking Data Science with Machine Learning bootcamp with NYC Data Science Academy.

GitHub

Introduction

The National Health Care Anti-Fraud Association data estimates conservatively that healthcare fraud costs the nation about $68 billion every year. Often it comes from clinics and hospitals overcharging insurance companies by submitting fraudulent claims. There is a 30-day investigation limit for claims that are potentially fraudulent. This time constraint makes it difficult to do an adequate investigation before the insurance company has to pay, which means these frauds often remain undetected. When insurance companies suffer losses, it makes it up by raising premiums. That means that we all, as patients and consumers, end up paying for fraud.

Objectives

  • Build a predictive model to help insurance companies detect potential fraudulent providers in order to reduce financial losses.
  • Identify the characteristics and behavior of potential fraudulent providers to inform and advise insurance companies for potential notification and alert systems.

Data description

The data  for this project was retrieved  from: https://www.kaggle.com/rohitrox/healthcare-provider-fraud-detection-analysis                    

 The data is comprised of four datasets below:

  • Inpatient records: over 40k records, including doctor IDs, provider IDs (clinic/hospital IDs), patient IDs, diagnosis codes, operation code, reimbursement information, etc.
  • Outpatient records: over 500k records with similar features to inpatient records.
  • Beneficiary records: over 130k patients with their pre-existing chronic conditions.
  • Fraudulent flags at the Provider level: about 9% of all providers were flagged with possible fraud. 


Challenge of the dataset

  • Imbalanced dataset: The potentially-fraudulent providers make up only 9% of the total dataset. 
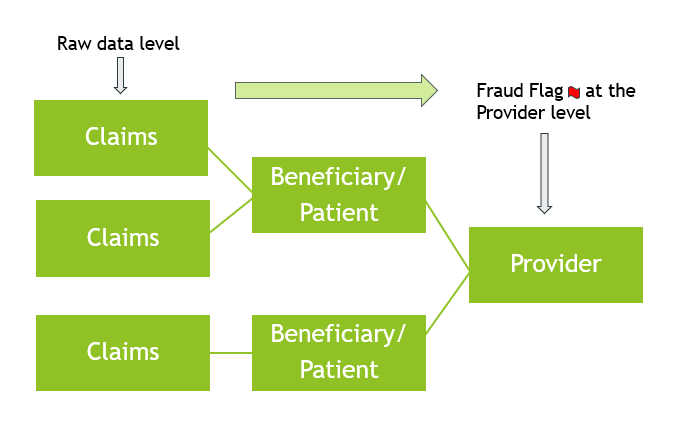
  • Different levels of data: We had to bring the raw data from the Claims level to the Provider level first by aggregating and feature engineering(discussed later) before we could do any modeling because that is where the response variable was. The 3 different levels were: 
    • Claims level: Our dataset started at the claims level with outpatient and inpatient records.
    • Beneficiary level: Beneficiaries or patients can have one or more claims, depending on the diagnosis and the treatment they receive. 
    • Provider level: Providers are practices and hospitals that provide medical services. Each provider can have multiple patients/beneficiaries. We can think of providers being at the highest level, which is where they are flagged as potentially fraudulent or non-fraudulent. 
Utilizing Data to Predict and Characterize Healthcare Fraud

Data on Feature Engineering

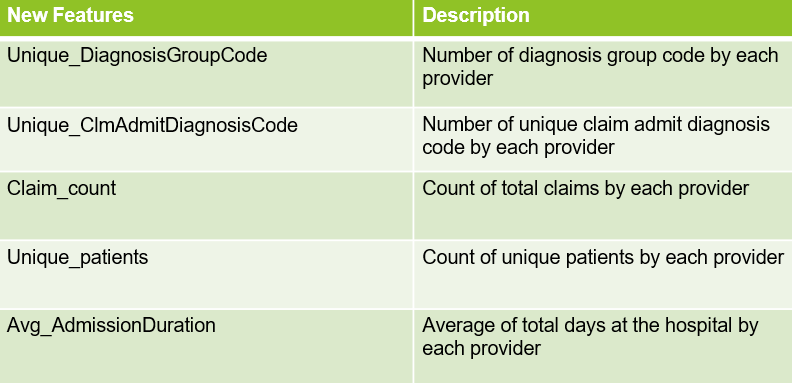
In the process of bringing the data from the claims level to the provider level, we merged all the datasets - inpatient, outpatient, and beneficiary -  into one main dataset. Then we aggregated and transformed the data to the provider level so we could add the potential fraudulent flags. As a result, we engineered 35 new features. Below is a list of some of the engineered features that were also found to be important in predicting potential fraudulent providers during modeling.

Utilizing Data to Predict and Characterize Healthcare Fraud

Exploratory Data Analysis (EDA)

Once we had all the features at the provider level, we were ready to do Exploratory Data Analysis. Below are some of the insights we found from our analysis.

Utilizing Data to Predict and Characterize Healthcare Fraud

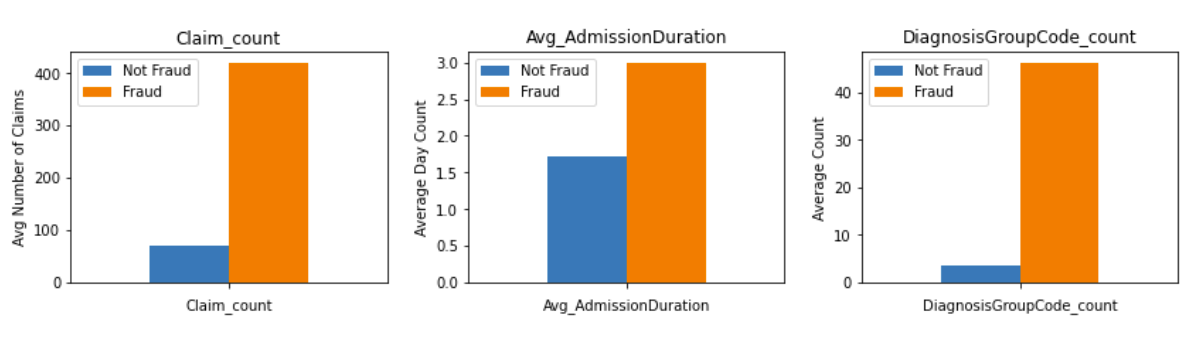
According to the bar plots above, we found that

  • Potential fraudulent providers on an average had more claim counts than non-fraudulent providers.
  • Potential fraudulent providers have a much higher average number of diagnosis group codes than non fraudulent providers. 
  • The patients under potential fraudulent providers have longer hospital stays than non fraudulent providers. 

The scatterplot above shows the relationship between the number of unique counties and claim count. We found that with an increase in the number of unique counties, the probability of the provider being potentially fraudulent increased.

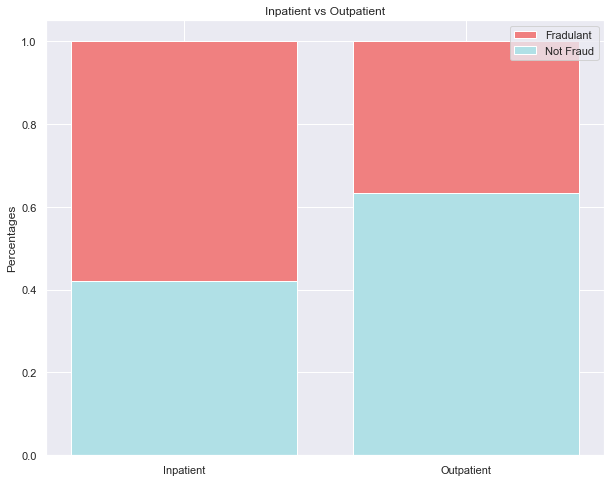
Inpatients are patients who stay overnight or longer at the hospital; outpatients are people who visit the hospital for their particular cause and leave within the same day. The stacked bar chart above shows that potentially fraudulent providers service more inpatients than outpatients.  

Modeling

Due to the imbalance of the fraudulent/non-fraudulent providers, we decided to upsample the observations with fraudulent providers, as they were the minority class. Using SMOTE, we upsampled our observations with fraudulent providers from 9% to 30%. SMOTE creates new observations of the minority class by creating convex combinations of neighboring observations, as opposed to duplicating the existing minority class observations. Afterwards, we had to normalize the data using StandardScalar. Then, we were ready to model.

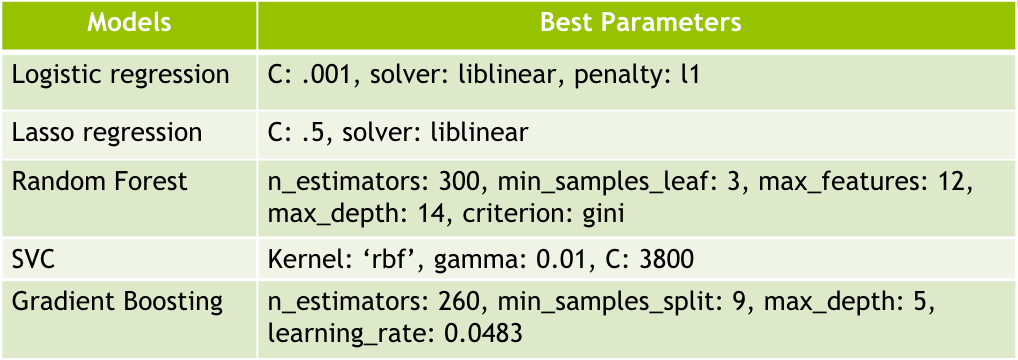
First, we started with Logistic Regression using gridsearch as a baseline for model comparison. Our Logistic Regression chose an l1(Lasso) penalty from its best parameters, so we decided to use Lasso to look at what features were kept. Next, Lasso kept 17 features to be important in identifying potentially fraudulent providers. Afterwards, we trained non-linear models, such as Random Forest, Support Vector Classifier (SVC), and Gradient Boosting Classifier, with the original 35 features to see if they would choose any different features than what Lasso kept due to non-linear relationships. 

Below are the best parameters that each model came up with through gridsearch:

Also, we saw that there were common features that were found most significant among all the models. They are marked on the following graphs in blue boxes. 

Lasso Features:

Random Forest - Top Features:

Gradient Boosting Classifier - Top Features:

From these models, we gathered our best AUC_ROC and recall scores to determine our best model to identify potentially fraudulent providers.

Model Selection: 

From the five different models we trained, Support Vector Classifier had the best overall score as well as the recall score as seen from the figures below. We prioritized the Recall score because we wanted to ensure each potentially fraudulent provider getting detected as fraudulent over non-fraudulent providers getting mis-flagged as fraudulent.  

Recall Definition in our case is:

With this in mind, we took the overall score into account by averaging both the AUC_ROC accuracy score and the recall score. The following figure shows the scores obtained by all the models in comparison to each other.  

We chose the Support Vector Classifier (SVC) as our best model since it had the best overall score of 0.783, taking into account both the recall score (0.677) as well as the AUC_ROC Accuracy score (0.888):

Using the confusion matrix, our best model SVC had identified 103 potentially fraudulent providers correctly, and we will be using this result in our business case:


Business Case & Recommendations: 

Keeping in mind the risk of lawsuit and litigation due to mis-classifying non-fraudulent providers as potentially fraudulent, we recommend insurance companies use our best model, SVC, as a guide to shortlist their providers. These providers can then be screened through a more rigorous review based on the following characteristics we found common among potentially fraudulent providers:

  • They use 43 more Diagnosis Group Codes on average than non-fraudulent providers. 
  • On average they process 350 more claims than non-fraudulent providers.
  • They provide coverage in 14 more unique counties than non-fraudulent providers. 
  • Their patients have 1.3 more days of hospital stay on average than those of non-fraudulent providers.

For the potentially fraudulent providers that are filtered through the characteristics and found guilty upon the insurance companiesโ€™ rigorous screening, the potential cost savings from utilizing our best model could amount to $70,746,183.40 based on taking the product of the following values computed from our dataset:

155 (median claims per provider) x $4431.33 (average claim cost per provider) x 103 (providers identified as fraudulent) = $70,746,183.40 (savings per year) 

Conclusion:

Finally, we have seen how complex and hard-to-track healthcare fraud is from our analysis as it is a crime that can hide itself in a variety of ways and involve multiple parties. With that said, we have found the top important features contributing to the likelihood of potential fraudulent providers to be: 

  • Unique Diagnosis Group Code 
  • Unique Claim Admit Diagnosis Code
  • Claim count
  • Admission Duration 
  • Unique patients 

Red flags include proxying for characteristics, such as providers using more unique diagnosis group codes as well as admittance diagnosis codes, perhaps for misrepresenting the nature of the actual service to make it more expensive or to fabricate claims out of thin air.  It can be seen from the data that not only is the hospital stay longer on average with potential fraudulent providers, but also the number of claims is higher. This means that the business volume is greater, suggesting larger hospitals and clinics.  Furthermore, the number of unique patients was an important feature for all of our models (negative for lasso) suggesting that potential fraudulent providers had more repeat patients.   

Lastly, for further analysis, we would like to get more clearly labeled data that is representative of certain regions within the U.S, as we were not able to make further conclusions without making major assumptions. Using this type of representative data, we would like to build a potential fraudulent provider notification and tracking system that filters providers based on certain characteristic thresholds. Doing so and utilizing our best model will not only save the insurance companies from financial loss, but also will save patients from paying higher health insurance premiums while stopping bad apples from thriving on this white-collar crime.  

About Authors

Augi Bold

NYC Data Science Academy Fellow with an Industrial Engineering background and experience in operations management and consulting. A dynamic professional with a thorough approach equipped with Python, R, and machine learning skills as well as Oracle Database SQL...
View all posts by Augi Bold >

Jesse Egoavil

Data Analyst with a passion to yield insights for business needs, create impactful, data-driven storytelling, and continually refine my technical skills.
View all posts by Jesse Egoavil >

Rupali Pahouja

NYC Data Science Academy Fellow, proficient in Python, R, and Machine Learning skills.
View all posts by Rupali Pahouja >

Related Articles

R
Data Analysis on The Mental Health Crisis
Python
Data Analysis on WallStreetBets and Its Impact On the Market
Python
Data Analysis on Our Happiness and Environmental Indicators
Python
Using Auction House Data to Evaluate Classic Cars
Student Works
Data Study on Top Manufacturing Companies by Income in 2020

Leave a Comment

No comments found.

View Posts by Categories

All Posts 2399 posts
AI 7 posts
AI Agent 2 posts
AI-based hotel recommendation 1 posts
AIForGood 1 posts
Alumni 60 posts
Animated Maps 1 posts
APIs 41 posts
Artificial Intelligence 2 posts
AWS 13 posts
Banking 1 posts
Big Data 50 posts
Branch Analysis 1 posts
Capstone 206 posts
Career Education 7 posts
CLIP 1 posts
Community 72 posts
Congestion Zone 1 posts
Content Recommendation 1 posts
Cosine SImilarity 1 posts
Data Analysis 5 posts
Data Engineering 1 posts
Data Engineering 3 posts
Data Science 7 posts
Data Science News and Sharing 73 posts
Data Visualization 324 posts
Events 5 posts
Featured 37 posts
Function calling 1 posts
FutureTech 1 posts
Generative AI 5 posts
Hadoop 13 posts
Image Classification 1 posts
Innovation 2 posts
Kmeans Cluster 1 posts
LLM 6 posts
Machine Learning 364 posts
Marketing 1 posts
Meetup 144 posts
MLOPs 1 posts
Model Deployment 1 posts
Nagamas69 1 posts
NLP 1 posts
OpenAI 5 posts
OpenNYC Data 1 posts
pySpark 1 posts
Python 16 posts
Python 458 posts
Python data analysis 4 posts
Python Shiny 2 posts
R 404 posts
R Data Analysis 1 posts
R Shiny 560 posts
R Visualization 445 posts
RAG 1 posts
RoBERTa 1 posts
semantic rearch 2 posts
Spark 17 posts
SQL 1 posts
Streamlit 2 posts
Student Works 1687 posts
Tableau 12 posts
TensorFlow 3 posts
Traffic 1 posts
User Preference Modeling 1 posts
Vector database 2 posts
Web Scraping 483 posts
wukong138 1 posts

Our Recent Popular Posts

AI 4 AI: ChatGPT Unifies My Blog Posts
by Vinod Chugani
Dec 18, 2022
Meet Your Machine Learning Mentors: Kyle Gallatin
by Vivian Zhang
Nov 4, 2020
NICU Admissions and CCHD: Predicting Based on Data Analysis
by Paul Lee, Aron Berke, Bee Kim, Bettina Meier and Ira Villar
Jan 7, 2020

View Posts by Tags

#python #trainwithnycdsa 2019 2020 Revenue 3-points agriculture air quality airbnb airline alcohol Alex Baransky algorithm alumni Alumni Interview Alumni Reviews Alumni Spotlight alumni story Alumnus ames dataset ames housing dataset apartment rent API Application artist aws bank loans beautiful soup Best Bootcamp Best Data Science 2019 Best Data Science Bootcamp Best Data Science Bootcamp 2020 Best Ranked Big Data Book Launch Book-Signing bootcamp Bootcamp Alumni Bootcamp Prep boston safety Bundles cake recipe California Cancer Research capstone car price Career Career Day ChatGPT citibike classic cars classpass clustering Coding Course Demo Course Report covid 19 credit credit card crime frequency crops D3.js data data analysis Data Analyst data analytics data for tripadvisor reviews data science Data Science Academy Data Science Bootcamp Data science jobs Data Science Reviews Data Scientist Data Scientist Jobs data visualization database Deep Learning Demo Day Discount disney dplyr drug data e-commerce economy employee employee burnout employer networking environment feature engineering Finance Financial Data Science fitness studio Flask flight delay football gbm Get Hired ggplot2 googleVis H20 Hadoop hallmark holiday movie happiness healthcare frauds higgs boson Hiring hiring partner events Hiring Partners hotels housing housing data housing predictions housing price hy-vee Income industry Industry Experts Injuries Instructor Blog Instructor Interview insurance italki Job Job Placement Jobs Jon Krohn JP Morgan Chase Kaggle Kickstarter las vegas airport lasso regression Lead Data Scienctist Lead Data Scientist leaflet league linear regression Logistic Regression machine learning Maps market matplotlib Medical Research Meet the team meetup methal health miami beach movie music Napoli NBA netflix Networking neural network Neural networks New Courses NHL nlp NYC NYC Data Science nyc data science academy NYC Open Data nyc property NYCDSA NYCDSA Alumni Online Online Bootcamp Online Training Open Data painter pandas Part-time performance phoenix pollutants Portfolio Development precision measurement prediction Prework Programming public safety PwC python Python Data Analysis python machine learning python scrapy python web scraping python webscraping Python Workshop R R Data Analysis R language R Programming R Shiny r studio R Visualization R Workshop R-bloggers random forest Ranking recommendation recommendation system regression Remote remote data science bootcamp Scrapy scrapy visualization seaborn seafood type Selenium sentiment analysis sentiment classification Shiny Shiny Dashboard Spark Special Special Summer Sports statistics streaming Student Interview Student Showcase SVM Switchup Tableau teachers team team performance TensorFlow Testimonial tf-idf Top Data Science Bootcamp Top manufacturing companies Transfers tweets twitter videos visualization wallstreet wallstreetbets web scraping Weekend Course What to expect whiskey whiskeyadvocate wildfire word cloud word2vec XGBoost yelp youtube trending ZORI

NYC Data Science Academy

NYC Data Science Academy teaches data science, trains companies and their employees to better profit from data, excels at big data project consulting, and connects trained Data Scientists to our industry.

NYC Data Science Academy is licensed by New York State Education Department.

Get detailed curriculum information about our
amazing bootcamp!

Please enter a valid email address
Sign up completed. Thank you!

Offerings

  • HOME
  • DATA SCIENCE BOOTCAMP
  • ONLINE DATA SCIENCE BOOTCAMP
  • Professional Development Courses
  • CORPORATE OFFERINGS
  • HIRING PARTNERS
  • About

  • About Us
  • Alumni
  • Blog
  • FAQ
  • Contact Us
  • Refund Policy
  • Join Us
  • SOCIAL MEDIA

    ยฉ 2025 NYC Data Science Academy
    All rights reserved. | Site Map
    Privacy Policy | Terms of Service
    Bootcamp Application