Winton Kaggle Competition
Contributed by Zach Escalante. He is currently in the NYC Data Science Academy 12 week full time Data Science Bootcamp program taking place between April 11th to July 1st, 2016. This post is based on his final class project - Capstone (due on the 12th week of the program)
Introduction
This Capstone project was an exciting opportunity for me to implement a sampling of the many machine learning techniques we as a bootcamp have been practicing for these past 12 weeks.
For my final project, I settled on working on a data set that was part of a Kaggle competition posted by Winton Capital Management which closed several months ago. I chose this specific competition because it addressed the difficult task of predicting time series. This is a very relevant problem for the financial industry (how to model asset returns, which are usually a stationary process) and one which I wanted to tackle with a plethora of new tools at my disposal. One of the important questions regarding stationary processes for financial data sets deals with outlier detection. Is it possible to implement a model that can predict (or even give a hint) as to when to expect a large movement either up or down in an asset? We very recently had a prime example of this with the UK voting to leave the EU.
Here we see the Hi Yield credit default index dropped in excess of two points overnight:

The British Pound set record lows in a matter of hours versus the US dollar:

These recent events highlight the necessity of being able to model time series to the best of our ability, which is why I chose this project to work on for my Capstone.
The Competition:
The Kaggle competition provided a training data set that contained 40,000 rows and 211 columns. Each row represented an observation of an asset (these could have been stocks, currencies, commodities or bonds - for linguistic ease and simplification, we will refer to them as stocks), and each column was a variable. Our first columns 2-26 were data features, the next two columns (27 & 28) were the T-2 and T-1 returns, after that we had 180 single-minute returns for the current day, followed by T+1 and T+2 returns and the two weight columns. Our goal for the competition as to use the features, T-2, T-1 and the first 120 minutes worth of returns to predict the next 60 minutes of returns and the T+1 and T+2 returns.

In order to score the predictions, the contestants had to minimize the Weighted Mean Average Error:

This meant taking each prediction and taking the difference between the prediction and the actual values and multiplying them by the respective weight. Then we sum these weights and divide by the number of observations to find the WMAE. To give some context or the difficulty of this data set, with over 800 people submitting predictions to be scored, a prediction of straight zeros (so no predictions whatsoever) would have been the 323rd best score on the leaderboard.
The Approach
My approach was to run two different models on the data set: one to predict the minute returns and the other to predict the T+1 and T+2 returns. For the T+1 and T+2 returns, I decided to use an XGBoost with stacking, due to this method's reputation for accuracy. For the minute returns, I settled on something I found in research, an Echo State Network model (a specific type of Recurrent Neural Net).
Echo State Network
A Recurrent Neural Network (RNN) is a type of Neural Network (NN) that can recursively call the output from a hidden layer of neurons and use that information to feed back into that same layer of neurons (1).

This is different than a feedforward structure in a typical NN where the output of each neuron on layer N feeds to each neuron in layer N+1 (dependent on whether the signal to that neuron have been triggered or not).

The Echo State Network (ESN) is a special type of the RNN where all of the weights assigned to the input vector and the pre-specified hidden layers are randomly assigned and only the last layer's output regression weights are trained (2).

The inputs to the ESN are summarized in this graphic

Where the update equations are as follows

and the final outputs are this

The algorithm is run as follows:

I chose an ESN to analyze the 60 individual minute returns of our data set for the simple reason that the recurrent nature of the network helps it to handle time series quite well (3). The ESN Algorithm has three main parameters to tune: the reservoir size (size of our hidden layer matrix), the spectral radius (this scales the weights of the reservoir matrix) and alpha, the leaking rate.
XGBoost
An XGBoost with stacking has historically performed very well for many people competing in Kaggle competitions. Due to the prolificacy of the XGBoost algorithm, I will focus on the practical implementation steps in after the data was cleaned and our missingness addressed in R:
- Fit a sparse model matrix to our data frame

- Run a Matrix

- Set the parameters


 4. Train our model
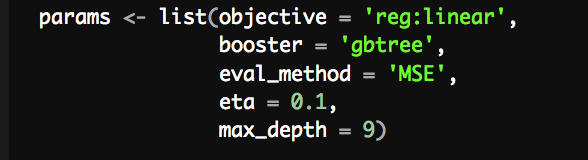

The tuning parameters that I found to give the greatest accuracy for my XGBoost model was grounds = 500, a max_depth = 9, and an eta = 0.1.
Results
For my ESN model, I optimized the parameters according to the minimization of the WMAE function. In order to determine whether our model was an improvement over our benchmark (guessing zero for each return), I graphed the WMAE of our model predictions over a subset of our training data:
Reservoir Size

We can see here that a reservoir size of 130 is the reservoir size that gets the closes to beating our benchmark.
Spectral Radius

After choosing my spectral radius, I settled on a radius factor of 1.25 value which once again, gets me the closest to beating our zero benchmark.
Alpha Parameter: Leaking Rate

Lastly I tuned the alpha parameter and was unable to beat a zero benchmark. Unfortunately this meant that Echo State Network failed to add predictive accuracy to my data set. The main reason for this I believe is that the model was only able to learn for 120 observations for each stock. This is not nearly enough training data as per the examples I encountered in order to gain predictive power. Other examples I saw has a minimum of several thousand observations.
Considering that adding the predictions including the individual minute returns would only increase my WMAE and decrease my final submission rank, I chose to only submit my T+1 returns using an XGBoost:

My final rank was a 747th on the leaderboard.
Improvements and Future Work
In order to improve my XGBoost algorithm, I need to spend more time analyzing important variables and tuning my XGBoost. I'm confident that with more time dedicated to these steps, I could break through the 0-guess benchmark that placed in the top 50% of all submissions.
The more interesting part to me is exploring how to create an ESN algorithm that can both capture the pattern, and in predict the movements of a stationary time series data set. Research in this area is limited, but preliminary results indicate this is possible. I believe that financial assets (stocks, bonds, currencies - I realize these are not all technically 'assets', but they would still suffice) with long time series histories and multiple potential explanatory variables would be a promising data bank to work from.
Thank you for taking the time to read this blog. If you have additional questions or comments, feel free to reach out to me at zach.escalante@gmail.com
References:
(1) http://blog.josephwilk.net/ruby/recurrent-neural-networks-in-ruby.html
(2) http://minds.jacobs-university.de/sites/default/files/uploads/papers/PracticalESN.pdf
(3) http://minds.jacobs-university.de/ESNresearch